
Updated on 09.07.2026|12:01 PM
SBI Funds Management Limited is launching a public issue to divest promoter stakes worth up to ₹11,692.91 crores. It is the largest mutual fund asset management company in India.
Because this public offer is entirely an Offer for Sale (OFS) running from July 14–16, 2026, the company will not retain any of the raised capital.
Equity shares are valued from ₹545 to ₹574 each, and retail participants must subscribe to at least 26 shares.
This article presents an in-depth breakdown of the SBI Funds Management IPO, tracing the latest grey market trends and subscription velocity. Investors can find verified information regarding the allotment schedule alongside an assessment of the offering price.
Briefs of SBI Funds Management IPO Details
- Price Band: ₹545 – ₹574 per share (Employee Discount: ₹54 per share)
- IPO Open / Close Dates: 14 July 2026 / 16 July 2026
- Lot Size: 26 shares (₹14,924 minimum)
- Issue Size: 20,37,09,239 shares / ₹11,102.15 – 11,692.91 crores
- Fresh Issue / OFS: Nil Fresh Issue / OFS of 20,37,09,239 shares
- Registrar: KFin Technologies Limited
- Listing Exchange: NSE, BSE
IPO Reservation
- Face value: ₹1 per share
- Anchor offer: Up to 60% of the QIB Portion
- QIB-shares: Not more than 50% of the Net Offer
- NIIs-Shares offered: Not less than 15% of the Net Offer
- RIIs- Shares offered: Not less than 35% of the Net Offer
What is the Current Grey Market Premium (GMP) for the SBI Funds Management IPO?
Our GMP central tracking portal enables you to monitor changing premiums for various listings, though market participants must remember that these numbers represent an unofficial gauge unregulated by SEBI, BSE, or NSE and respond purely to day-to-day market forces.
What is the Subscription, Closure, and Allotment Calendar for SBI Funds Management?
- IPO Open & Close Date: 14 July 2026 to 16 July 2026
- Basis of Allotment Date: 17 July 2026
- Refund Initiation Date: 20 July 2026
- Credit of Shares: 20 July 2026
- Listing Date: 21 July 2026
What are the Key Fundraising Purposes for the SBI Funds Management IPO?
As a complete Offer for Sale (OFS), 100% of the shares in this issue are being sold by the promoters, aimed at achieving the following purposes:
- To carry out the sale of 20,37,09,239 equity shares by the promoters (State Bank of India and Amundi India Holding).
- The issue aims to secure the advantages of listing equity shares on public exchanges, offering a liquid exit route for current shareholders, and boosting corporate brand exposure.Capital Note: Since this transaction is structured as an Offer for Sale, the company itself will not collect any direct proceeds from the fundraise.
How is The Financial Performance of SBI Funds Management Limited ?
Figures in Crores
Period Ended | 31 Mar 26 | 31 Mar 2025 | 31 Mar 24 |
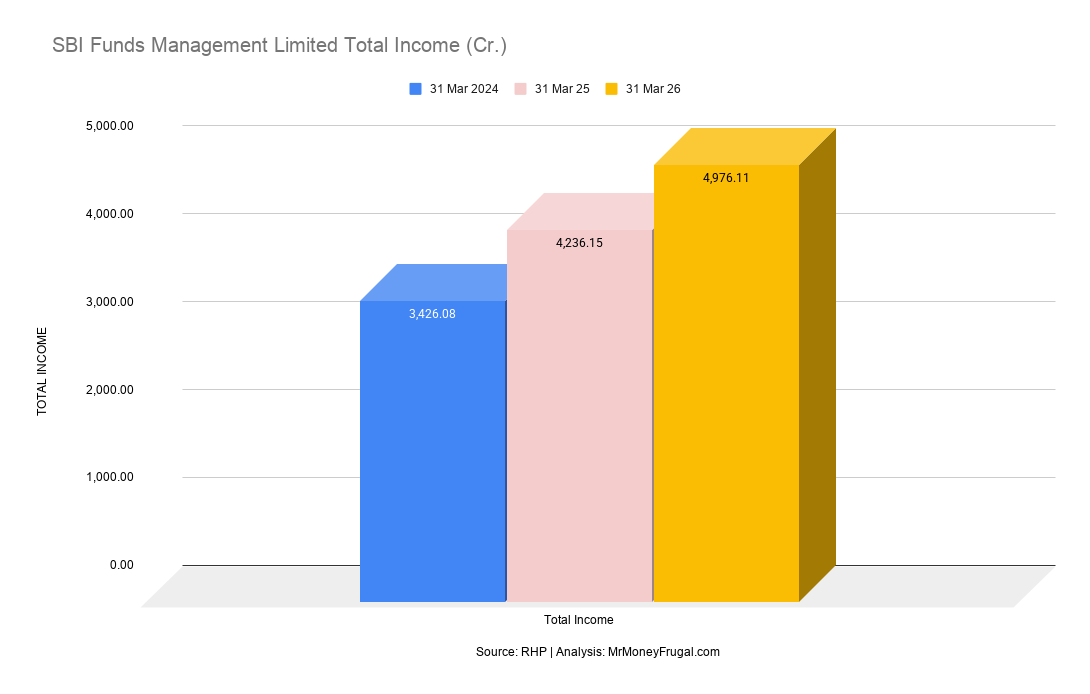
Total Income | 4,976.11 | 4,236.15 | 3,426.08 |
Profit After Tax | 3,067.38 | 2,540.15 | 2,072.79 |
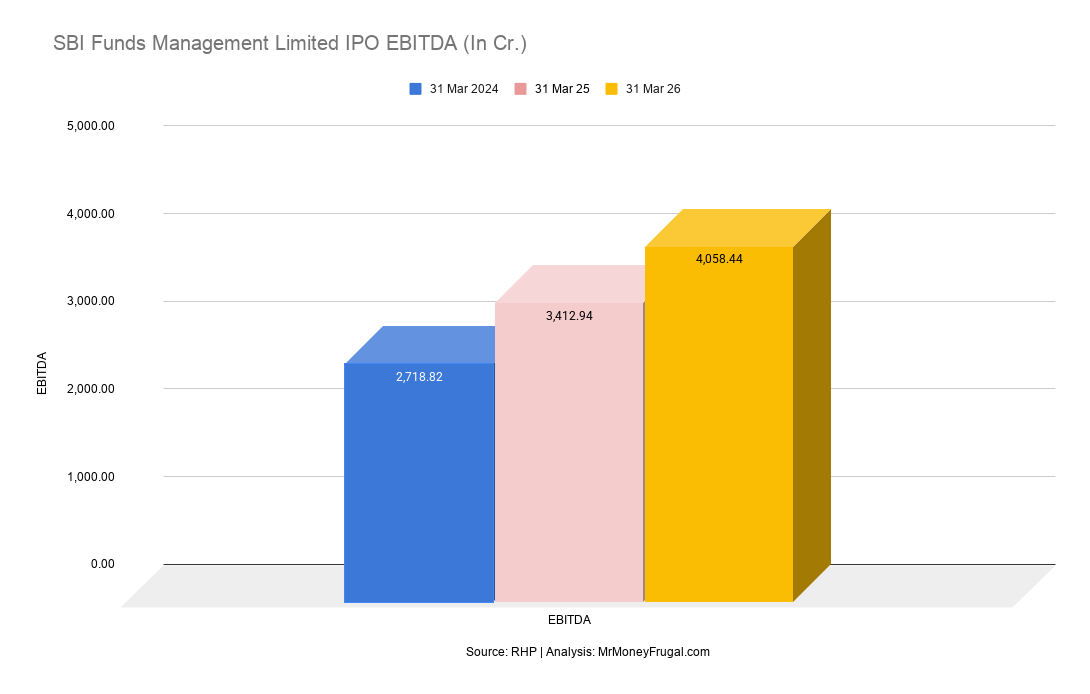
EBITDA | 4,058.44 | 3,412.94 | 2,718.82 |
Total Borrowing | 0.00 | 0.00 | 0.00 |
Assets | 6,420.45 | 8,771.86 | 7,106.93 |
Source: RHP
Financial Observation
Total Income
The company displayed a continuous year-on-year increase in its overall earnings across the reported fiscal periods.
- This was supported by the consistent expansion of its mutual fund Assets Under Management (AUM).
- The growth reflects a steady accumulation of management fees from both retail and institutional clients.
Profit After Tax
The net earnings expanded consistently in alignment with the growing operational scale of the business.
- PAT reached ₹3,067.38 crores in FY26 due to cost-efficient operational leverage.
- The figures indicate the ability to scale up without a proportional rise in administrative expenses.

EBITDA
The core operational earnings reflect a cash-generative business model with minimal capital requirements.
- The company recorded an EBITDA margin of over 92% in the latest fiscal year.
- These margins correspond to the lowest cost-to-income ratio (19.5%) among the top ten mutual fund houses.
Total Borrowing
The firm operates with a completely debt-free balance sheet across all the evaluated financial years.
- It relies entirely on its internal cash generation to fund everyday operations.
- The business remains unaffected by interest rate burdens or debt servicing obligations.
Assets The total resource base of the company observed a notable drop in the final reported fiscal year despite rising revenues.
- Assets reduced from ₹8,771.86 crores in FY25 to ₹6,420.45 crores in FY26.
- This shift was caused by the liquidation of mutual fund investments to facilitate a massive ₹5,515.13 crore dividend payout to shareholders.
What Are the P/E ratio and Peer Comparison?
At the upper price band of ₹574 and a Basic EPS of ₹15.08 for FY26, SBI Funds Management Limited's P/E ratio stands at approximately 38.06x (calculated as ₹574 / ₹15.08).
Peer Comparison Table:
|
Analysis:
*SBI Funds Management enters the primary market with a P/E multiple of approximately 38.06x at the upper price band.
When compared to the industry composite average of 41.64, the issue presents a relatively moderated multiple compared to listed leaders like Nippon Life India (51.10x) and ICICI Prudential (49.38x).
Furthermore, SBI AMC reports a Return on Net Worth (RoNW) of 43.02%, placing it second in the sector behind ICICI Prudential. Its commanding market share and low-cost structure offer a distinct operational profile compared to its domestic peers.
What is The Industry Outlook of SBI AMC?
Growth potential: The Indian mutual fund industry continues to benefit from the financialization of domestic savings. Retail participation has shifted away from traditional physical assets into capital markets, largely driven by systematic investment plans (SIPs) that ensure consistent monthly inflows.
Market trends and competitors: The landscape is highly concentrated among the top asset management companies. Going forward, the industry faces structural adjustments, including SEBI's new Base Expense Ratio (BER) framework and a visible consumer shift toward lower-margin passive investment products like ETFs and index funds.
What Are The Strengths and Risks of SBI Funds Management IPO ?
Strengths:
- Parentage and Distribution: Backed by State Bank of India and Amundi, the company leverages a massive network of over 23,000 SBI branches and the YONO digital application.
- SIP Franchise: It commands a 15.5% market share by live SIP count, managing 16.21 million accounts that provide sticky, predictable capital inflows.
- B-30 Market Penetration: The firm leads the industry in Beyond Top 30 (B-30) cities, capturing 19.2% of the sector's B-30 MAAUM and accessing a growing retail demographic.
Risks:
- Regulatory Fee Compression: The new SEBI Base Expense Ratio (BER) guidelines effective April 2026 cap the Total Expense Ratio (TER), which may compress operating margins and management fee yields.
- Market Vulnerability: Because revenues are a direct percentage of AUM, any macroeconomic shock or capital market downturn can cause a compound cycle of falling portfolio values and investor redemptions.
- Concentration Risk: The top 5 mutual fund schemes account for 42.57% of the total QAAUM. Underperformance in these specific flagship funds could negatively impact overall revenue collection.
Key Considerations for Investors
- 100% OFS Structure: The ₹11,692.91 crore issue is entirely an Offer for Sale. Consequently, the company receives no fresh capital for future growth.
- Regulatory Fee Compression: SEBI’s new Base Expense Ratio framework implements tighter TER caps, which may compress management fee yields and operating margins.
- Market & Concentration Risks: Revenue is directly linked to AUM, exposing the firm to market volatility. Furthermore, 42.57% of its QAAUM is concentrated in just five flagship schemes.
- Shift to Passive Funds: Passive products like ETFs carry significantly lower expense ratios (0.04%-0.36%) than active funds. Rising consumer demand for these low-margin instruments could dilute overall revenue yields.
Key Takeaways
- IPO Price Band: ₹545 to ₹574 per equity share (Employee discount of ₹54 per share)
- Lot Size: 26 shares (Minimum retail application of ₹14,924)
- Allotment Dates: Allotment on 17 July 2026
- Listing Dates: Listing on NSE and BSE on 21 July 2026
Important IPO Resources:
1. IPO Calendar India | Upcoming & Live IPOs in India
2. IPO Allotment Status – How to Check Allotment Status of IPO Shares
3. IPO Glossary: 100+ Important Terms Every Investor Should Know
4. Latest IPO Subscription Status Today | Live Updates
5. GMP vs Listing Gains June 2026 IPOs: A Data Analysis of 22 IPOs
6. June 2026 IPO Review: 22 IPOs, ₹2,502 Cr Raised & 75.98x Average Subscription
FAQs on SBI Funds Management IPO
What is SBI Funds Management IPO GMP trading for today?
You can find the latest GMP updates for this mainboard issue on our dedicated GMP hub page, as unofficial premium indicators change based on current market demand.
What is SBI Funds Management IPO price band?
The equity shares for this issue have a set price range of ₹545 to ₹574 each, with a dedicated ₹54 discount on the final issue price extended to qualifying corporate employees.
What is the official share allocation timeline for the SBI Funds Management IPO?
The basis of allotment will be finalised on 17 July 2026.
How can investors check if they have been allocated shares in the SBI Funds Management IPO?
Investors can confirm their share allocation by visiting the online portal of the official registrar, KFin Technologies Limited, or by using the dedicated allotment verification platforms of the NSE and BSE after entering their PAN or application number.
What is SBI Funds Management IPO listing date?
The equity shares are proposed to be listed on the NSE and BSE platforms on 21 July 2026.
Investment Perspective on SBI Funds Management IPO
SBI Funds Management presents a compelling opportunity as India’s largest asset manager holding a 15.3% market share and a dominant 15.5% share in live SIPs. Backed by SBI and Amundi, it operates a highly efficient, debt-free model with an exceptional 92.46% EBITDA margin and the lowest operating expense ratio among its peers. While regulatory fee compression and its 100% Offer for Sale structure require monitoring, its unmatched scale and deep regional penetration strongly position it for sustainable long-term growth.
Disclaimer:
The shared data serves solely as a learning resource and should not be treated as professional investment counseling.It is strongly advised to seek guidance from a SEBI-registered professional prior to committing capital.
