
In July 2026, a total of 33 IPOs were listed in the Indian stock market, of which 13 were Mainboard IPOs and 20 were SME IPOs.
This review presents key details such as subscription trends, capital raised, and listing performance, including the percentage of IPOs that listed at a profit, loss, or at the issue price across both the SME and Mainboard segments.
Investors interested in more details can visit our Latest IPO section, which provides key information on listed, upcoming, and live IPOs in the Indian stock market.
July 2026 IPO Market Snapshot (Key Data & Trends)
No Of IPOs Listed: 33
SME IPOs: 20
Mainboard IPOs: 13
Total Capital Raised: ₹21140.52 Crores
Average Subscription: 56.37x
Mainboard IPO Average Subscription: 40.33x
SME IPO Average Subscription: 66.79x
IPOs Listed at Profit: 69.70%
IPOs Listed at Loss: 21.21%
IPOs Listed at No Profit & No Loss: 9.09%
IPO Distribution July 2026 – SME vs Mainboard
| SME IPOs | 20 |
| Mainboard IPOs | 13 |
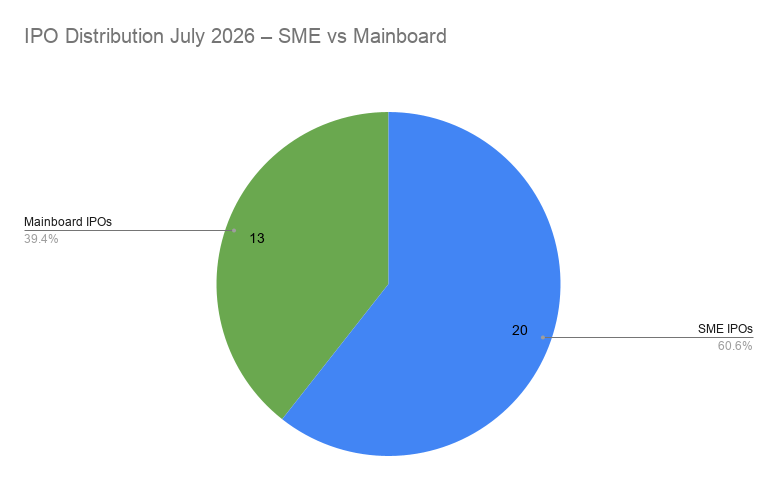
IPO Distribution July 2026 – SME vs Mainboard
Mainboard Vs SME: Capital Raised by IPOs in July 2026 (In Cr.)
| SME IPOs | 44.49 |
| Mainboard IPOs | 1,557.75 |
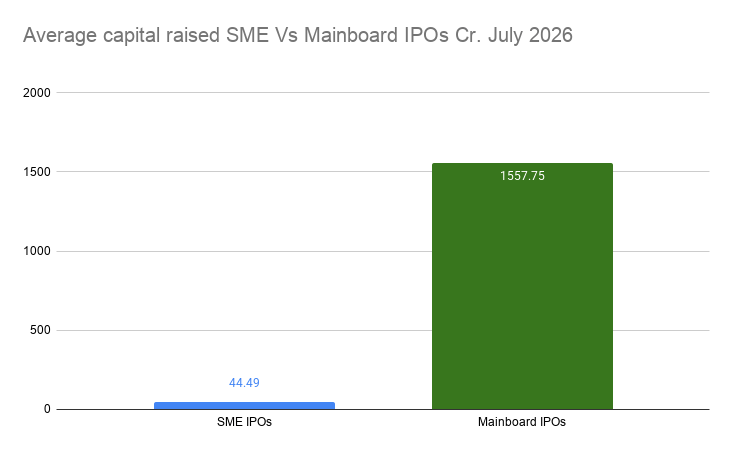
Average capital raised SME Vs Mainboard IPOs Cr. July 2026
SME IPOs raised: ₹889.73 Crore
Millworks Technologies raised the highest amount of 160.33 Cr. among SME IPOs.
And Gulf Lloyds (India) raised the lowest amount of 18.19 Cr.
Mainboard IPOs raised: 20250.79 Crore
Among Mainboard IPOs, SBI Funds Management raised the highest amount of 11,692.91 Cr. & Alpine Texworld raised the lowest amount of 126.25 Cr.
Average Capital Raised Per IPO in July 2026
Avg capital raised per SME IPOs : 44.49 Cr.
Avg capital raised per Mainboard IPOs: 1557.75 Cr.
It means on an average Mainboard IPOs raised 35.02x more capital per IPO compared to SME IPOs.
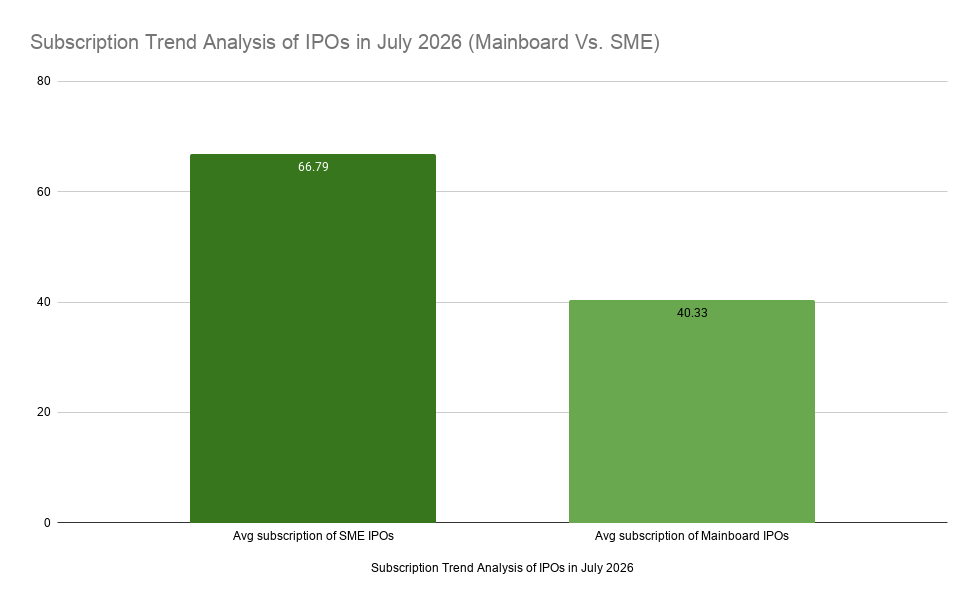
Subscription Trend Analysis of IPOs in July 2026
Avg subscription of SME IPOs: 66.79x
Avg subscription of Mainboard IPOs: 40.33x
So, SME IPOs attracted 1.66x more demand than the mainboard IPOs in July 2026.
Listing Performance Overview For July 2026 IPOs
Mainboard IPOs: July 2026 Listing Performance
Highest listing gain: 44.33% by Indo-MIM
Weakest listing performance: -15.72% by Cordelia Cruises (Waterways Leisure Tourism Limited)
Average listing gain: 12.67%
Out of the 13 Mainboard IPOs:
69.23% listed at a premium
15.38% listed below issue price
15.38% listed at par
SME IPOs: July 2026 Listing Performance
Highest listing gain: 90%, delivered by 3 IPOs, Millworks Technologies, Teja Engineering Industries, and Shree Balaji (Mala) Textiles
Weakest listing performance: -20%, recorded jointly by Jivial Industries, Seemax Resources, and Riyaasat Lifestyle
Average listing gain: 22.5%
Out of the 20 SME IPOs:
70.00% listed at a premium
25.00% listed below issue price
5.00% listed at issue price (No Profit & No Loss)
Table: Complete IPO Listing Performance – July 2026 (SME & Mainboard)
Key IPO Market Insights – July 2026
- SME IPOs attracted stronger investor interest, recording an average subscription of 66.79×, compared to 40.33× for Mainboard IPOs.
- Mainboard IPOs overwhelmingly dominated capital raising activity in July 2026, contributing ₹20,250.79 crore out of the total ₹21,140.52 crore raised during the month.
- Listing performance was strong, with 69.70% of IPOs listing at a premium, while 21.21% debuted below their issue price and 9.09% listed at par.
- SME IPOs significantly outperformed Mainboard IPOs in average listing returns, delivering an average gain of 22.50%, compared to 12.67% for Mainboard IPOs.
Important IPO Resources:
1. June 2026 IPO Review: 22 IPOs, ₹2,502 Cr Raised & 75.98x Average Subscription
3. IPO Listing Performance Tracker 2026 – Complete Dataset of IPO Listing Gains in India
4. IPO Valuation vs Listing Performance Study 2026
5. Latest IPO Subscription Status Today | Live Updates
6. IPO Glossary: 100+ Important Terms Every Investor Should Know
FAQ on July 2026 IPO Review
1. How many IPOs were listed in July 2026?
A total of 33 IPOs were listed in July 2026, comprising 20 SME IPOs and 13 Mainboard IPOs.
2. How much capital was raised through IPOs in July 2026?
Companies raised a combined ₹21,140.52 crore through IPOs listed in July 2026. Mainboard IPOs accounted for ₹20,250.79 crore, while SME IPOs raised ₹889.73 crore.
3. Which IPO delivered the highest listing gain in July 2026?
Millworks Technologies, Teja Engineering Industries, and Shree Balaji (Mala) Textiles were the top-performing IPOs of July 2026, with each listing at a 90% premium over its issue price.
4. How did SME IPOs perform compared to Mainboard IPOs in July 2026?
SME IPOs outperformed Mainboard IPOs in both investor demand and average listing returns. SME IPOs recorded an average subscription of 66.79x, compared to 40.33x for Mainboard IPOs. They also delivered an average listing gain of 22.50%, versus 12.67% for Mainboard IPOs.
5. What percentage of IPOs listed at a profit in July 2026?
Out of the 33 IPOs listed in July 2026, 69.70% listed at a premium, 21.21% debuted below their issue price, and 9.09% listed at par.
6. Which Mainboard IPO delivered the highest listing gain in July 2026?
Indo-MIM was the best-performing Mainboard IPO of July 2026, listing at a 44.33% premium over its issue price.
7. Which IPO raised the most capital in July 2026?
SBI Funds Management raised the most capital among IPOs listed in July 2026, with an issue size of ₹11,692.91 crore. It accounted for more than half of the total IPO capital raised during the month.
Conclusion
July 2026 stood out for its strong listing performance, with nearly 7 out of every 10 IPOs making a positive market debut. However, the wide gap between the best and worst performers also showed that strong IPO activity did not translate into gains across every issue.
