
Hy-Tech Engineers Limited operates as an established precision engineering company, specialising in the manufacturing of hydraulic valves, fittings, and associated fluid connector components for diverse sectors including automotive, construction, and agriculture.
Investors can bid on the Hy-Tech Engineers mainboard IPO between August 24 and August 27, 2026. To raise up to ₹136.00 crore, the company is offering a ₹60.00 crore fresh issue alongside a ₹76.00 crore Offer for Sale from current promoters.
The issue is priced between ₹50 and ₹53 per share, requiring a minimum retail bid of 283 shares.
Investors can use this article to track essential details for the Hy-Tech Engineers IPO, covering the current grey market premium (GMP), subscription figures, pricing, allotment schedule, and an in-depth analysis.
Briefs of Hy-Tech Engineers IPO Details
- Price Band: ₹50 – ₹53 per share
- IPO Open / Close Dates: 24 August 2026 / 27 August 2026
- Lot Size: 283 shares (Minimum retail investment: ₹14,999)
- Issue Size: 2,56,10,204 shares / Up to ₹136.00 crores
- Fresh Issue / OFS: Fresh Issue of ₹60.00 crores / OFS of ₹76.00 crores
- Registrar: Bigshare Services Pvt.Ltd.
- Listing Exchange: BSE, NSE
Shareholder Quota
- Face value: ₹5 per share
- Anchor offer: Up to 60% of the QIB Portion
- QIB-shares: Not more than 50% of the Net Offer
- NIIs-Shares offered: Not less than 15% of the Net Offer
- RIIs- Shares offered: Not less than 35% of the Net Offer
What is the Hy-Tech Engineers IPO GMP Today?
For the latest GMP on this and other offerings, visit our GMP tracker. Investors should be aware that the GMP changes daily based on market sentiment and remains an unofficial metric unregulated by SEBI, NSE, or BSE.
What Are The Important Hy-Tech Engineers IPO Dates & Allotment Schedule?
- IPO Open & Close Date: 24 August 2026 to 27 August 2026
- Basis of Allotment Date: 28 August 2026
- Refund Initiation Date: 31 August 2026
- Credit of Shares: 31 August 2026
- Listing Date: 1 September 2026
What Are The Objectives of Hy-Tech Engineers IPO?
Hy-Tech Engineers will deploy the net proceeds from its fresh issue for the following objectives:
- Capital Expenditure: A significant portion of the funds is earmarked for purchasing advanced CNC machinery, setting up a barrel auto plating plant, and installing solar power plants to expand manufacturing capacities across the Shirwal, Kavathe, and Pithampur facilities.
- Debt Repayment: The firm will utilise the proceeds to prepay or repay certain outstanding borrowings, structurally deleveraging the balance sheet and lowering future interest outflows.
- General Corporate Purposes: The balance of the proceeds—subject to a maximum limit of 25% of the gross issue receipts—is earmarked for general operational contingencies and strategic corporate initiatives.(Note: All proceeds from the ₹76.00 crore Offer for Sale will go directly to the selling shareholders, rather than the company).
How is The Financial Performance of Hy-Tech Engineers?
Provided below is a summary of the company's financial statements, presented in Indian Rupees (in crores).
Period Ended | 31 Mar 26 | 31 Mar 2025 | 31 Mar 24 |
Total Income | 193.44 | 166.71 | 141.17 |
Profit After Tax | 22.59 | 19.62 | 11.60 |
EBITDA | 41.69 | 35.79 | 22.55 |
Total Borrowing | 29.76 | 43.53 | 40.84 |
Assets | 175.71 | 170.65 | 146.24 |
Source: RHP
Financial Observations
Total Income
The company registered a highly robust upward trajectory in its revenue streams across the observed fiscal periods.
- Total income scaled impressively from ₹141.17 crores in FY24 to ₹193.44 crores in FY26.
- Strong direct sales to original equipment manufacturers (OEMs) supported this volume scale-up.
- A growing export footprint spanning 11 countries contributed to this consistent top-line momentum.
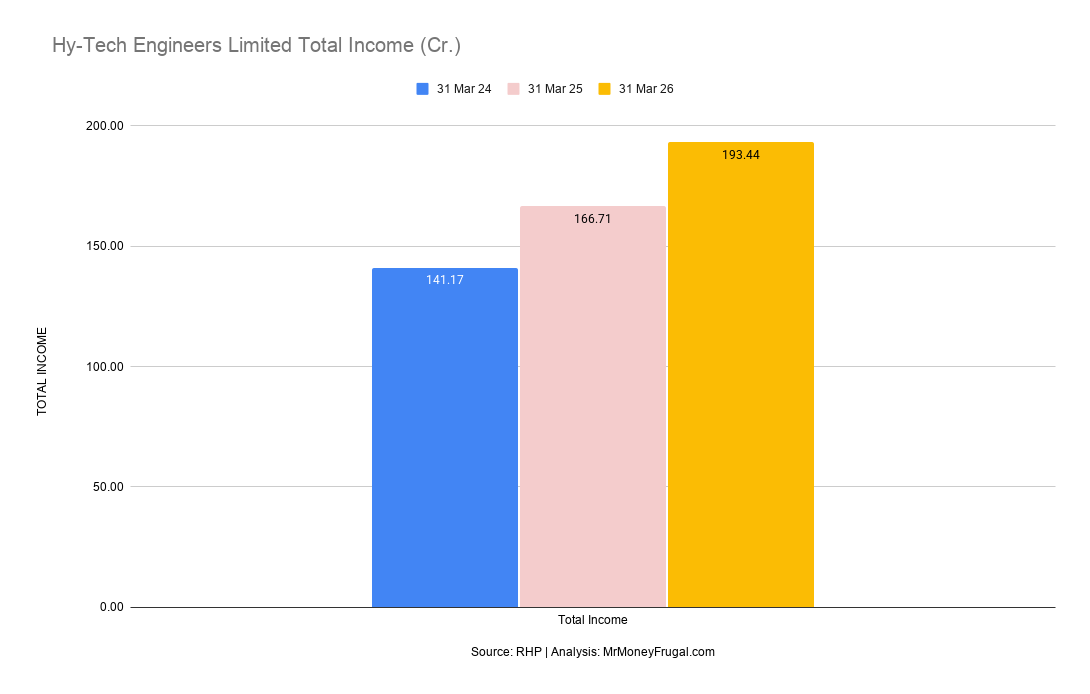
Hy-Tech Engineers Total Income, FY24–FY26 (₹ crore)
Profit After Tax
Net profitability experienced substantial sequential growth, demonstrating a firm recovery from prior margin pressures.
- PAT surged remarkably from ₹11.60 crores in FY24 to ₹22.59 crores in FY26.
- Improved operating leverage and disciplined overhead management aided this bottom-line result.
- The firm maintained strong profit conversion while absorbing rising depreciation costs from recent capacity expansions.
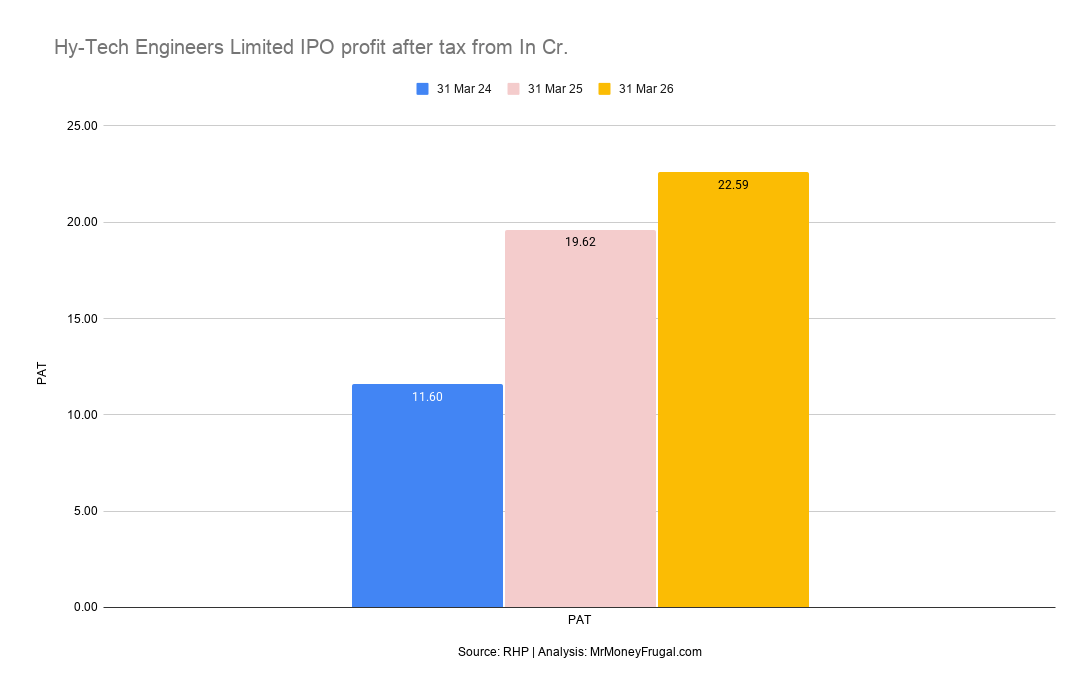
Hy-Tech Engineers Profit After Tax, FY24–FY26 (₹ crore)
EBITDA
Core operational earnings advanced significantly, reflecting the firm's strict control over manufacturing costs.
- EBITDA almost doubled from ₹22.55 crores in FY24 to ₹41.69 crores in FY26.
- The EBITDA margin expanded structurally, reaching a highly competitive 22.01% in the latest fiscal year.
- The use of a protective 'converter model' shielded these margins against global steel price volatility.
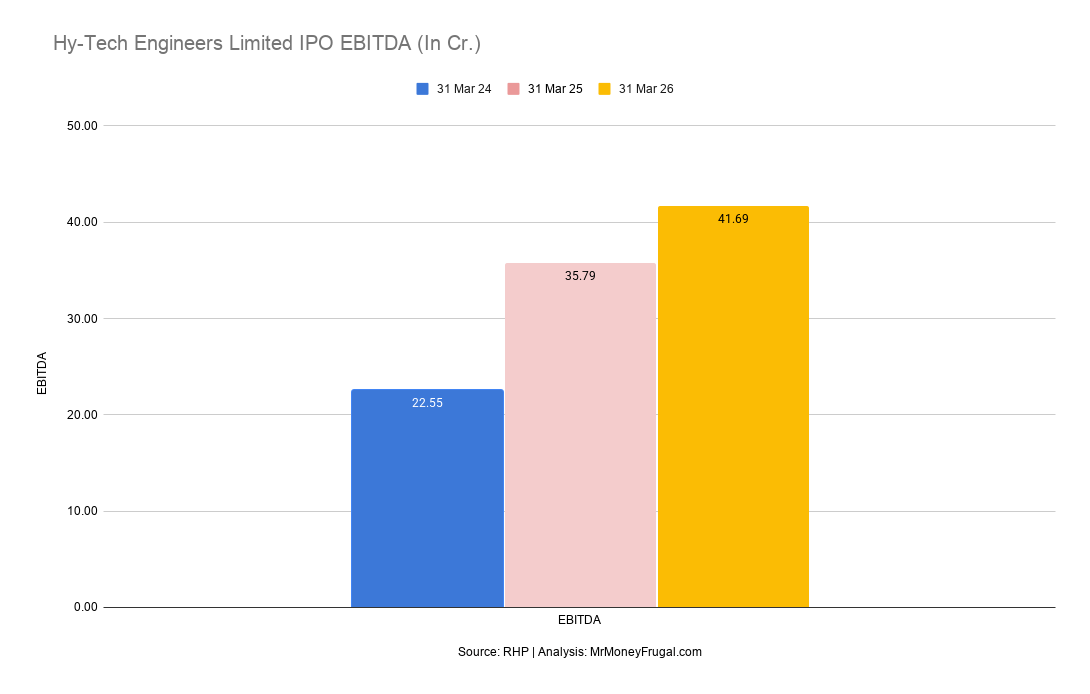
Hy-Tech Engineers EBITDA, FY24–FY26 (₹ crore)
Total Borrowing
The business executed an aggressive debt-repayment strategy prior to the IPO, de-risking its capital structure.
- Total borrowings were systematically reduced from ₹43.53 crores in FY25 to ₹29.76 crores in FY26.
- This proactive deleveraging brought the net debt-to-equity ratio down to a highly conservative 0.22x.
- A dedicated portion of the fresh IPO proceeds aims to further reduce these outstanding financial liabilities.
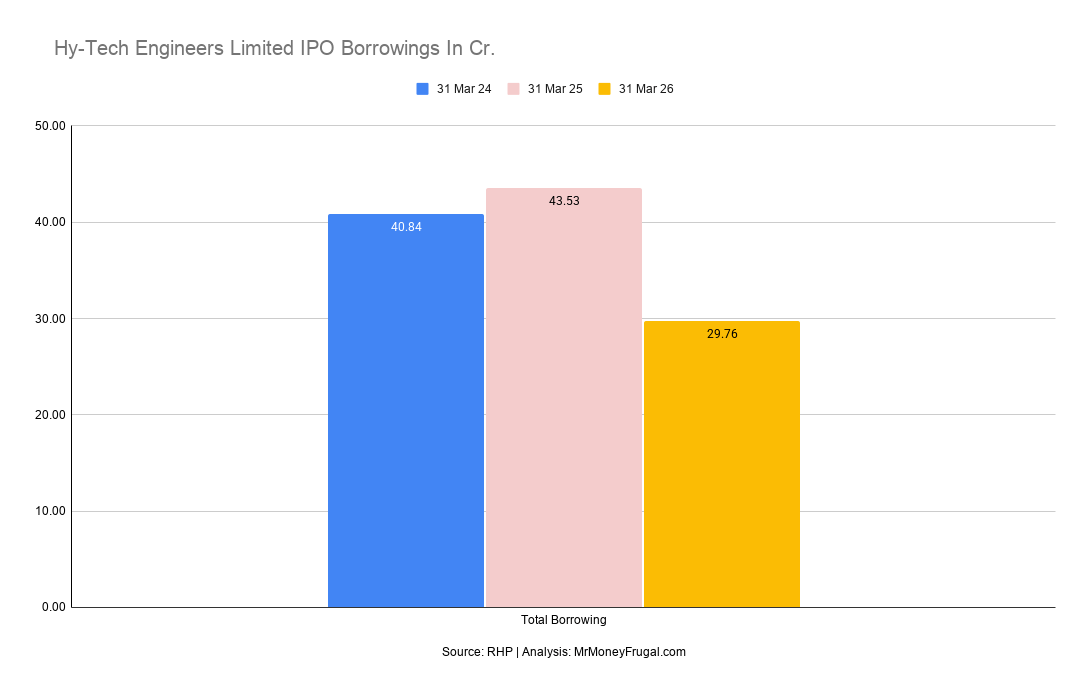
Hy-Tech Engineers Total Borrowing, FY24–FY26 (₹ crore)
Assets
The overall resource base of the company widened to accommodate continuous, strategic capital expenditures.
- Total assets grew steadily from ₹146.24 crores in FY24 to ₹175.71 crores in FY26.
- This build-up represents active capital deployment in advanced CNC machining and testing infrastructure across multiple units.
- The upcoming IPO-funded capital expenditure will further enlarge this physical asset base post-listing.
What Are the P/E ratio and Peer Comparison of Hy-Tech Engineers Limited?
The Price-to-Earnings (P/E) ratio for Hy-Tech Engineers is evaluated at 19.63x, determined by the upper issue price of ₹53 and the FY26 EPS of ₹2.70.
Name of the Company | Revenue from Operations (₹ Cr) | Face Value (₹) | Basic EPS (₹) | P/E Ratio | RoNW (%) | NAV (₹) |
Hy-Tech Engineers Limited | 189.40 | 5 | 2.70 | 19.63 | 20.24 | 14.61 |
Aeroflex Industries Limited | 441.94 | 2 | 4.28 | 107.04 | 14.06 | 33.80 |
Dynamatic Technologies Ltd | 1,621.34 | 10 | 47.73 | 230.32 | 7.89 | 1,168.41 |
Yuken India Limited | 462.17 | 10 | 10.81 | 69.32 | 4.27 | 274.66 |
Analysis:
Hy-Tech Engineers enters the primary market demanding an implied P/E multiple of approximately 19.63x at the upper price band.
When evaluated against listed industry peers like Yuken India (69.32x) and giants like Dynamatic Technologies (230.32x) and Aeroflex Industries (107.04x), the issue is priced at a stark discount.
While operating on a smaller absolute revenue base (₹189.40 crores) compared to these peers, Hy-Tech boasts a highly exceptional Return on Net Worth (RoNW) of 20.24%, significantly outpacing Aeroflex (14.06%) and Dynamatic (7.89%).
This indicates extremely efficient capital utilisation, giving stock pickers a highly lucrative margin of safety based on current sector valuations.
What is the Industry Outlook of Hy-Tech Engineers Limited?
Growth potential
- The domestic precision engineering and hydraulic components sector is experiencing strong tailwinds, supported by the national "Make in India" manufacturing push and massive infrastructure expenditures.
- Rising demand for heavy construction and agricultural machinery ensures a steady, long-term volume runway for reliable ancillary component suppliers.
- The global "China Plus One" sourcing strategy is aggressively repositioning India as an export hub for specialised, high-tolerance engineering components.
Market trends
- The manufacturing of hydraulic fluid connectors requires significant technical competence and stringent quality control, establishing high entry barriers for unorganised players.
- To protect operating margins against volatile raw material prices (primarily steel), manufacturers are increasingly adopting direct order-backed "converter models".
- Firms are strategically shifting towards decentralised, cell-based manufacturing layouts to enhance operational agility and reduce overhead conversion costs.
What Are The Strengths and Risks of Hy-Tech Engineers IPO ?
Strengths:
- Exceptional Return Metrics: The business generates an industry-leading Return on Net Worth (RoNW) of 20.24% in FY26, vastly outperforming its listed peers.
- Margin Expansion: The transition to a decentralised, cell-based manufacturing model helped expand EBITDA margins from 16.38% in FY24 to a highly competitive 22.01% in FY26.
- Deleveraged Balance Sheet: A proactive debt-repayment strategy lowered total borrowings to just ₹29.76 crores in FY26, bringing the net debt-to-equity ratio down to a highly conservative 0.22x.
Risks:
- Customer Concentration: The top 10 customers contributed 45.32% of total operational revenues in FY26, exposing the firm to individual order cancellations.
- Absence of Long-Term Contracts: The company does not enter into long-term or exclusive agreements with customers, operating purely on a cyclical purchase-order basis.
- Unhedged Forex Exposure: Exports accounted for 29.37% of revenues in FY26, yet the company maintains no active forward contract hedging policies, exposing margins to currency volatility.
Key Considerations for Investors
- Valuation Arbitrage: At the upper band, the company demands an implied P/E of ~19.63x, offering a steep valuation discount compared to peers like Aeroflex (107.04x) and Dynamatic (230.32x).
- Capital Efficiency: Despite operating on a smaller revenue base, the firm reported an exceptional RoNW of 20.24% alongside a robust 22.01% EBITDA margin in FY26.
- Customer & Contract Risks: The business operates entirely without long-term client contracts, and the top 10 customers generate 45.32% of revenues, highlighting concentration risk.
- Forex Exposure: With nearly 30% of revenue coming from unhedged exports, the company’s operating margins are vulnerable to international currency fluctuations.
Important IPO Resources
1. IPO Allotment Status – How to Check Allotment Status of IPO Shares
3. July 2026 IPO Subscription Review: 32 IPOs Data, Demand Patterns & Key Trends
4. July 2026 IPO Review: 33 IPOs, ₹21140.52 Cr Raised & 56.37x Average Subscription
5. Mainboard & SME IPOs in India
Key Takeaways
- IPO Price Band: ₹50 to ₹53 per equity share
- Lot Size: 283 shares (Minimum retail application of ₹14,999)
- Allotment Date: Allotment on 28 August 2026
- Listing Date: Listing on BSE and NSE on 1 September 2026
FAQs on Hy-Tech Engineers IPO
The latest grey market premium trends for this mainboard issue are available on our centralized GMP hub. Investors should note that these unofficial metrics are subject to daily variance based on market dynamics.
The price band for the issue is set between ₹50 and ₹53 per equity share.
The finalization of the basis of allotment is scheduled for August 28, 2026
Upon finalization of the basis of allotment, investors may verify their allocation status via the official portal of the registrar, Bigshare Services Pvt. Ltd., or the respective BSE and NSE allotment platforms, by submitting their PAN or application details.
The official listing of the equity shares on the BSE and NSE platforms is scheduled for September 1, 2026.
Hy-Tech Engineers Limited demonstrates robust growth, supported by structural EBITDA margins of 22.01% and a peer-leading 20.24% Return on Net Worth.
Strategic balance sheet de-leveraging has reduced its net debt-to-equity ratio to a conservative 0.22, strengthening long-term financial resilience.
However, investors must weigh these operational strengths against key risks, including high customer concentration (top ten clients generate 45.32% of revenues) and completely unhedged foreign exchange exposure.
Market participants should base their decisions on a thorough reading of the prospectus, noting the company's customer concentration, lack of long-term contracts, and unhedged forex exposure.
Disclaimer: The details shared here serve as an educational overview rather than official investment advice. Investors should verify their choices with a SEBI-certified specialist before allocating funds
