
Shanti Inorganics Limited operates as a specialised manufacturer of high-purity, sulfur-based inorganic chemicals, primarily producing sodium bisulphite and ammonium bisulphite.
The Ahmedabad-based enterprise caters to critical industrial sectors such as food, beverage, and oil drilling across domestic and international markets.
Transitioning to the public markets, the Shanti Inorganics IPO opens for public subscription on August 31, 2026, and is scheduled to close on September 2, 2026.
The firm aims to raise up to ₹42.00 crores entirely through a fresh issue of 56,91,200 equity shares. The price band for this NSE EMERGE offering has been fixed at ₹79 to ₹83 per equity share, requiring a minimum retail application of 3,200 shares.
Readers will find essential details regarding the Shanti Inorganics IPO in this report, including the current grey market premium (GMP), subscription progress, key allotment dates, the specified price band, and an evaluation of the company.
Briefs of Shanti Inorganics IPO Details
- Price Band: ₹79 – ₹83 per share
- IPO Open / Close Dates: 31 August 2026 / 2 September 2026
- Lot Size: 1,600 shares (Minimum retail application of ₹2,65,600 for 2 lots)
- Issue Size: 56,91,200 shares / Up to ₹47.23 crores
- Fresh Issue / OFS: Fresh Issue of 56,91,200 shares / OFS: Nil
- Registrar: KFin Technologies Ltd.
- Listing Exchange: NSE SME
IPO Reservation
- Face value: ₹10 per share
- Anchor offer: Up to 60% of the QIB Portion
- QIB-shares: Not more than 50% of the Net Issue
- NIIs-Shares offered: Not less than 15% of the Net Issue
- RIIs- Shares offered: Not less than 35% of the Net Issue
What is the Prevailing Shanti Inorganics IPO GMP Rate Right now?
The daily grey market premium (GMP) for this issue, along with other upcoming IPOs, is available on our central hub.
Because it depends entirely on market demand, this figure updates daily and represents an unregulated, unofficial indicator outside the purview of SEBI, NSE, and BSE.
What are the Key Bidding Dates and Allocation Timelines for the Shanti Inorganics Listing?
- IPO Open & Close Date: 31 August 2026 to 2 September 2026
- Basis of Allotment Date: 3 September 2026
- Refund Initiation Date: 4 September 2026
- Credit of Shares: 4 September 2026
- Listing Date: 7 September 2026
How does Management Intend to Deploy the Net Proceeds from the Shanti Inorganics Issue?
According to leadership, the net proceeds from the fresh issue are earmarked for execution against the following core business milestones:
- Capital Expenditure: A massive allocation of ₹42.50 crores is designated to fund Phase II of Manufacturing Unit-II in Bavla, increasing total production capacity by 4.17x to 78,544 MTPA.
- General Corporate Purposes: A maximum limit of 15% of gross offering proceeds, or a monetary cap of ₹10.00 crores, will be utilized to finance routine corporate management costs, brand building, and marketing initiatives.
How is The Financial Performance of Shanti Inorganics ?
The financial health and past performance of the corporation are summarized below, utilizing Rupees Crores as the base reporting unit.
Period Ended | 31 May 26 | 31 Mar 26 | 31 Mar 2025 | 31 Mar 24 |
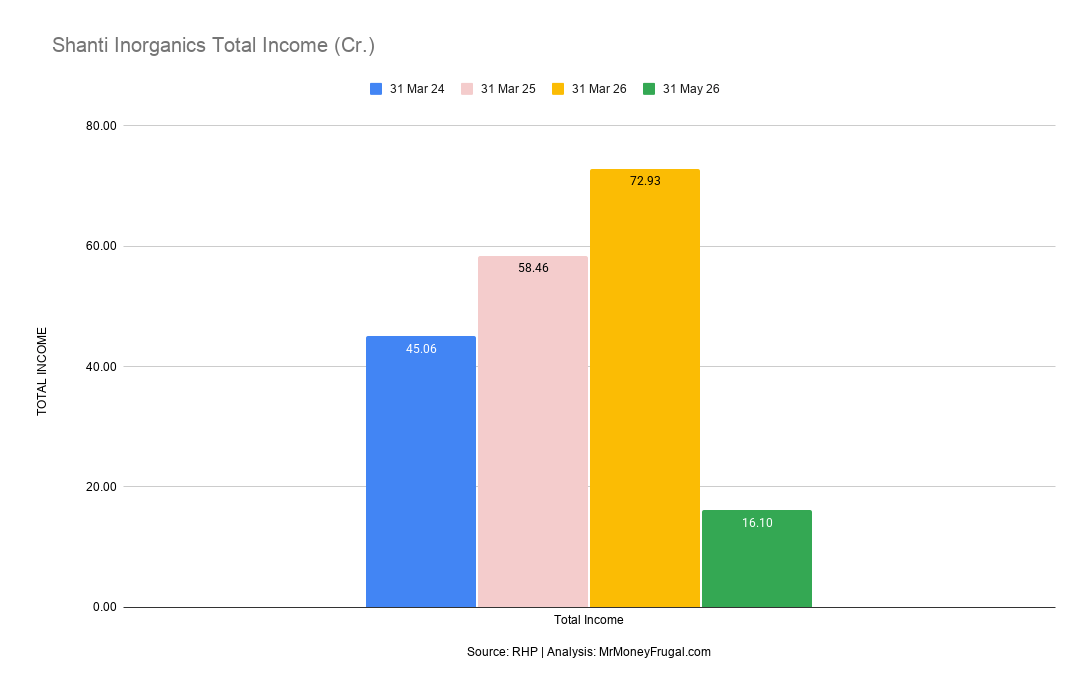
Total Income | 16.10 | 72.93 | 58.46 | 45.06 |
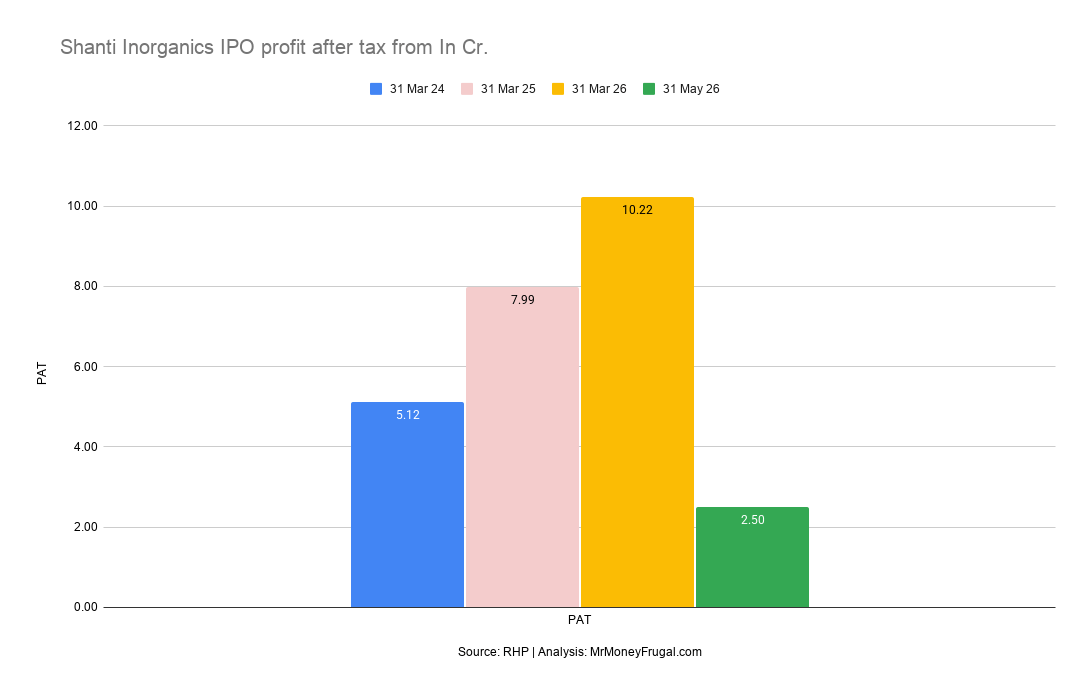
Profit After Tax | 2.50 | 10.22 | 7.99 | 5.12 |
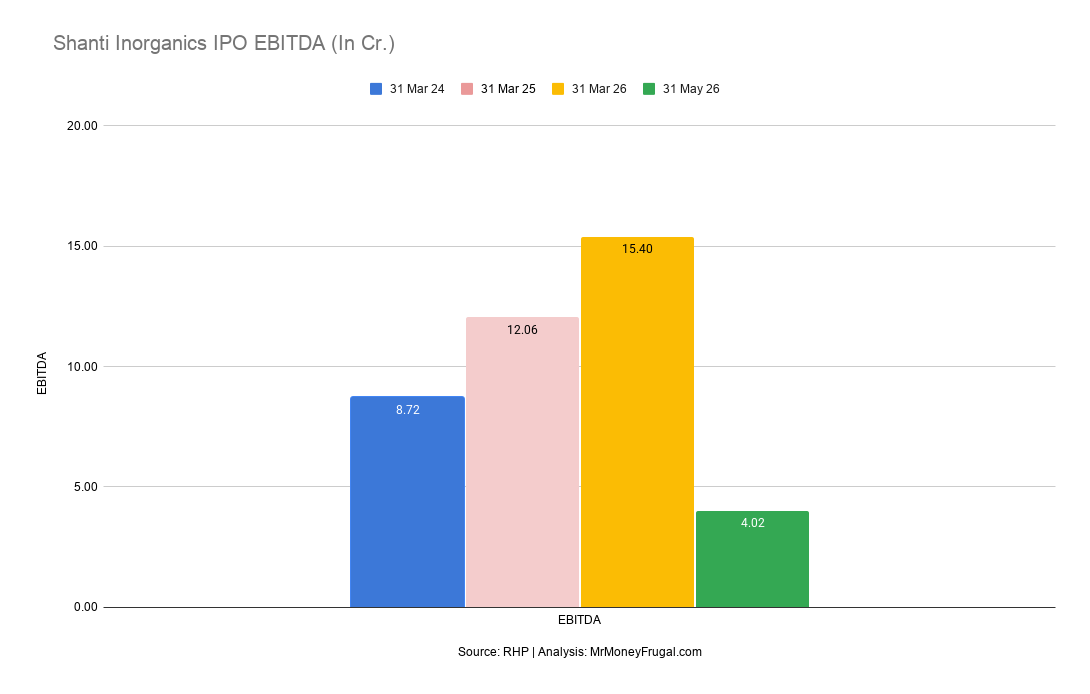
EBITDA | 4.02 | 15.40 | 12.06 | 8.72 |
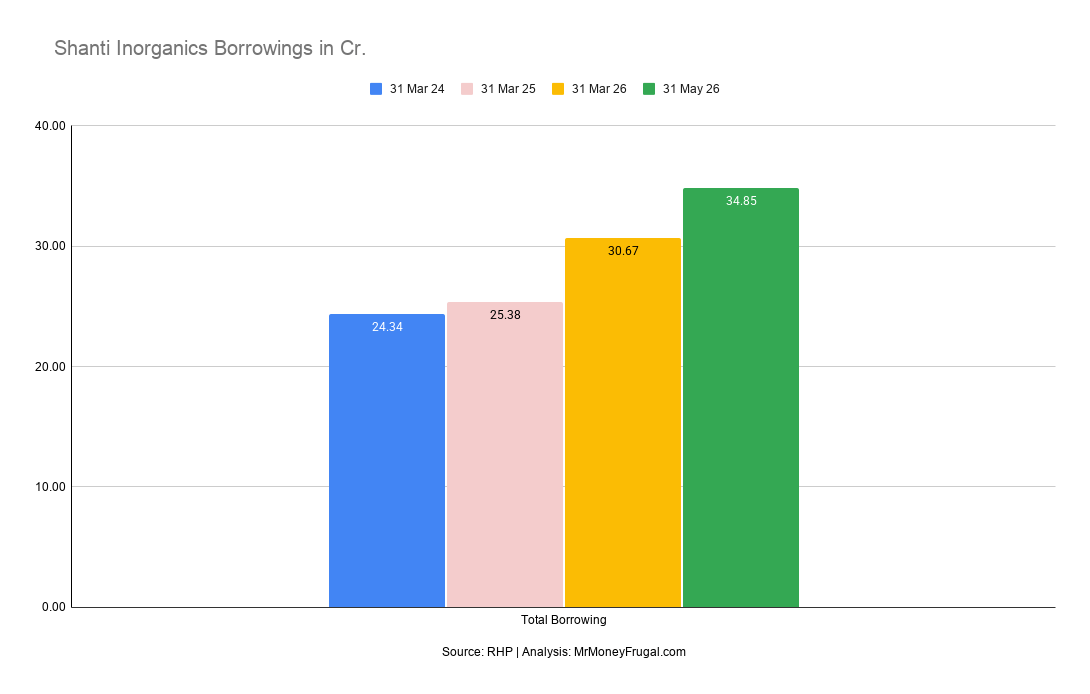
Total Borrowing | 34.85 | 30.67 | 25.38 | 24.34 |
Assets | 110.73 | 97.04 | 66.04 | 52.69 |
Source: Shanti Inorganics Limited RHP
Financial Observations
Total Income
The company registered a highly robust upward trajectory in its revenue streams over the observed fiscal periods.
- Total income expanded steadily from ₹45.06 crores in FY24 to ₹72.93 crores in FY26.
- This growth was propelled by increased export volumes, which accounted for 42.57% of sales in FY26.
- Higher average selling prices of active chemical compounds further supported this top-line momentum.
Shanti Inorganics Total Income (Cr.)
Profit After Tax
Net profitability experienced substantial sequential growth, demonstrating highly efficient operational leverage.
- PAT surged dramatically from ₹5.12 crores in FY24 to ₹10.22 crores in FY26.
- The PAT margin expanded to 14.01% in the latest full fiscal year.
- A reduction in raw materials consumed as a percentage of total income aided this bottom-line result.
Shanti Inorganics IPO profit after tax from In Cr
EBITDA
Core operational earnings advanced significantly, reflecting the firm's improved pricing power in niche chemical segments.
- EBITDA almost doubled from ₹8.72 crores in FY24 to ₹15.40 crores in FY26.
- The EBITDA margin widened to a competitive 21.62% during the most recent fiscal period.
- The commencement of Phase I operations unlocked substantial economies of scale.
Shanti Inorganics IPO EBITDA (In Cr.)
Total Borrowing
The business utilised external debt primarily to manage the high capital expenditure required for capacity expansion.
- Total borrowings rose from ₹24.34 crores in FY24 to ₹34.85 crores by May 2026.
- Despite this increase, the Debt-to-Equity ratio remained extremely conservative, dropping to 0.69x.
- A major portion of these funds supported the development of the Bavla manufacturing unit.
Shanti Inorganics Borrowings in Cr
Assets
The overall resource base of the company widened exponentially to accommodate its aggressive capacity-building plans.
- Total assets grew rapidly from ₹52.69 crores in FY24 to ₹110.73 crores by May 2026.
- This build-up is largely dominated by Property, Plant & Equipment and heavy capital advances for machinery.
- The planned Phase II expansion in Bavla will further enlarge this physical asset base post-listing.
What Are the P/E ratio and Peer Comparison of Shanti Inorganics Limited?
Computed using the peak price band threshold of ₹83 against the company's FY26 EPS of ₹9.36, the resulting P/E valuation multiple is 8.86x.
Name of the Company | Total Revenue (₹ Cr) | Face Value (₹) | Basic EPS (₹) | P/E Ratio | RoNW (%) |
Shanti Inorganics Limited | 71.22 | 10 | 9.36 | 8.86 | 27.68 |
Shalibhadra Dyechem Pvt Ltd | 29.31 | N/A | N/A | N/A | 17.53 |
Nilkanth Organics Pvt Ltd | 122.65 | N/A | N/A | N/A | 16.50 |
N/A- These are unlisted companies, so data is not available.
Analysis:
According to the Red Herring Prospectus, there are no listed peers in the Indian stock market whose product portfolio matches Shanti Inorganics' niche focus on sulfur-based inorganic bisulphites.
Consequently, a formal listed P/E comparison is unavailable. When evaluated against unlisted regional competitors like Shalibhadra Dyechem and Nilkanth Organics, Shanti Inorganics operates with a significantly superior Return on Net Worth (RoNW) of 27.68% and an EBITDA margin of 21.62%.
At the upper price band of ₹83, the firm demands an implied P/E multiple of approximately 8.86x. This reflects highly efficient capital utilisation and commanding pricing power, presenting an attractive valuation entry point for a high-margin business scaling its capacity.
What is the Industry Outlook of Shanti Inorganics Limited?
Growth potential
- The global specialty chemicals market is experiencing structural expansion, driven heavily by increased usage of bisulphites in water treatment, food preservation, and oil drilling.
- The "China Plus One" sourcing strategy is aggressively repositioning Indian chemical manufacturers as preferred, reliable alternatives for global supply chains.
- Rising domestic industrial CAPEX ensures a steady, high-volume market runway for high-purity inorganic chemical compounds.
Market trends
- The specialty chemical manufacturing sector requires immense upfront capital and strict adherence to environmental regulations, establishing high barriers to entry for unorganised players.
- Raw material cost volatility remains a persistent trend, forcing manufacturers to manage inventory tightly against global fluctuations in sulfur and ammonia prices.
- Companies are increasingly focused on expanding continuous process manufacturing lines over batch processing to maximise yields and protect operating margins.
What Are The Strengths and Potential Risks of Shanti Inorganics IPO?
Strengths:
- Margin Expansion: The company demonstrated exceptional operating leverage, with EBITDA margins expanding from 19.45% in FY24 to 21.62% in FY26.
- Superior Return Metrics: The business generates an industry-leading Return on Net Worth (RoNW) of 27.68% and a Return on Capital Employed (RoCE) of 23.40% in FY26.
- Export Momentum: A balanced geographic revenue mix, with high-margin export markets contributing 42.57% of total operational sales in FY26.
Risks:
- Raw Material Volatility: Relying on spot purchase orders without long-term supply agreements exposes margins directly to global price swings in sulfur dioxide and anhydrous ammonia.
- Customer Concentration: The top 5 customers accounted for 41.87% of total revenue in FY26, exposing the firm to individual order cancellations.
- Execution Risk: The firm is undertaking a massive ₹107.71 crore capex project (Phase II), introducing potential technology stabilisation and capacity utilisation risks.
Key Considerations for Investors
- Capacity Expansion Execution: The primary objective of the issue relies on successfully deploying funds to expand capacity by 4.17x, introducing severe execution and asset-utilisation risks.
- Customer Dependency: The firm is heavily reliant on a select group of clients, with the top 5 customers generating 41.87% of total FY26 revenue.
- Raw Material Exposure: Operating without long-term supply agreements leaves the company’s 21.62% EBITDA margins vulnerable to sudden price spikes in critical feedstocks like sulfur dioxide.
- Valuation Profile: With an implied P/E of ~8.86x, the issue is priced reasonably against its standalone robust earnings growth (41.3% PAT CAGR) and superior 27.68% RoNW.
Key Takeaways
- IPO Price Band: ₹79 to ₹83 per equity share
- Lot Size: 1,600 shares (Minimum retail application of ₹2,65,600 for 2 lots)
- Allotment; Allotment on 3 September 2026;
- Listing Date: Listing on NSE SME on 7 September 2026
Important iPO Resources
1. Upcoming & Live IPOs in India
2. IPO Allotment Status – How to Check Allotment Status of IPO Shares
4. July 2026 IPO Review: 33 IPOs, ₹21140.52 Cr Raised & 56.37x Average Subscription
5.July 2026 IPO Subscription Review: 32 IPOs Data, Demand Patterns & Key Trends
FAQs on Shanti Inorganics IPO
What is Shanti Inorganics IPO GMP today?
Investors can view the most recent grey market premium (GMP) updates for this SME offering on our dedicated tracking page, keeping in mind that these informal indicators fluctuate daily in response to market sentiment.
What is Shanti Inorganics IPO price band?
The equity share price range has been structured between a lower threshold of ₹79 and an upper limit of ₹83.
What is Shanti Inorganics IPO allotment date?
The basis of allotment is scheduled to be finalised on 3 September 2026.
How to check Shanti Inorganics IPO allotment status?
Once finalised, investors can verify their allotment status by visiting the official portal of the registrar, KFin Technologies Ltd., and submitting their PAN or application details.
What is Shanti Inorganics IPO listing date?
The equity shares are proposed to be listed on the NSE SME platform on 7 September 2026.
Investment Perspective on Shanti Inorganics IPO
Shanti Inorganics Limited presents a compelling growth narrative, driven by its superior operating efficiency (21.62% EBITDA margin) and a massive 4.17x capacity expansion at Bavla.
By outperforming unlisted peers on RONW, the company showcases strong pricing power in niche bisulphites.
However, prospective investors must weigh this against substantial execution risk, high customer concentration, and working capital pressure (0.89x current ratio).
At a private-funding valuation benchmark of 8.86x P/E, it offers high-growth potential balanced by raw material volatility.
Disclaimer: This information is intended for educational purposes only and does not constitute formal financial advice. Investors should consult a SEBI-registered investment advisor before making any financial commitments.
