
Updated on 19.08.2026
Pramodini Medicare Limited operates as a specialised healthcare company, providing advanced diagnostic imaging services through its network of teleradiology and clinical laboratories across Andhra Pradesh. Track all the latest IPOs of SME & Mainboard segment.
The company focuses heavily on radiology diagnostics, including MRI, CT, and PET-CT scans, often executing Public-Private Partnership (PPP) models with government hospitals.
To fund the purchase of new medical equipment and expand its diagnostic centres, the enterprise is entering the primary market to raise up to ₹69.00 crores via a combination of a fresh issue and an offer for sale.
Opening on August 12, 2026, and closing on August 14, 2026, the Pramodini Medicare IPO is priced in the ₹110–₹118 per equity share band, with a minimum retail application size of 2,400 shares.
This post covers the ongoing Pramodini Medicare IPO grey market premium, public demand metrics, allotment timeline, price range, and a comprehensive investment analysis.
Briefs of Pramodini Medicare IPO Details
- Price Band: ₹110 – ₹118 per share
- IPO Open / Close Dates: 12 August 2026 / 14 August 2026
- Lot Size: 1,200 shares (Minimum retail investment is 2 lots: 2,400 shares)
- Issue Size: 58,51,200 shares / Up to ₹69.00 crores
- Fresh Issue / OFS: Fresh Issue of 50,14,800 shares / OFS of 5,00,400 shares
- Registrar: Purva Sharegistry (India) Pvt.Ltd.
- Listing Exchange: NSE SME
IPO Reservation
- Face value: ₹10 per share
- Anchor offer: Up to 13,60,800 Equity Shares
- QIB-shares: Not more than 25,32,000 Equity Shares (Includes Anchor Portion)
- NIIs-Shares offered: Not less than 9,60,000 Equity Shares
- RIIs- Shares offered: Not less than 20,23,200 Equity Shares
Learn about these IPO terms in IPO Glossary: 100+ Important Terms Every Investor Should Know
Where does the Pramodini Medicare IPO GMP currently stand today?
Review this premium alongside other upcoming offerings on our centralized gmp tracker page.
Note: This information is purely an unofficial, demand-driven indicator that is not recognized, monitored, or regularised by SEBI or national stock exchanges.
You can't miss these important GMP studies: GMP vs Listing Gains: A Data Analysis of 17 IPOs Listed in February 2026 & GMP vs Listing Gains May 2026 IPOs: A Data Analysis of 14 IPOs
Listing Updates
| Metric | Value |
|---|---|
| Issue Price | ₹118 |
| Listing Price | ₹120 |
| Listing Gain/Loss | 1.69% |
| Final GMP | ₹0 |
| GMP % | 0% |
| Lowest GMP | ₹0 |
| Highest GMP | ₹0 |
| GMP vs Listing | Above Expectations |
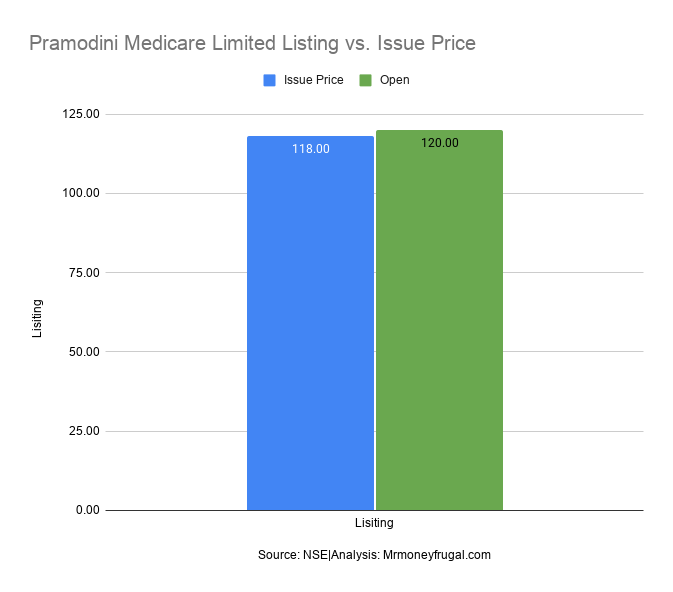
Pramodini Medicare IPO: Issue Price vs Listing Price.
What Are The Important Dates & Allotment Schedule for Pramodini Medicare IPO ?
- IPO Open & Close Date: 12 August 2026 to 14 August 2026
- Basis of Allotment Date: 17 August 2026
- Refund Initiation Date: 18 August 2026
- Credit of Shares: 18 August 2026
- Listing Date: 19 August 2026
What Are The Core Objectives of Pramodini Medicare IPO?
Pramodini Medicare directors plan to spend the net financial proceeds from the new equity issuance on the following key strategic initiatives:
- Capital Expenditure: A massive allocation of ₹45.15 crores is earmarked to purchase and install advanced medical equipment to upgrade existing centres in Hubli, Manjeri, and Vijayawada, alongside establishing a new PPP diagnostic centre in Bangalore.
- Inorganic Growth: The remaining funds will support potential opportunistic acquisitions of synergistic diagnostic entities to enter new domestic territories.
- General Corporate Purposes: A capped portion (up to 15% of gross proceeds) will fund routine administrative exigencies and brand-building activities.
How is The Financial Performance of Pramodini Medicare?
The table below outlines a high-level summary of the company's historical financial books, reported strictly in Rupees Crores.
Period Ended | 31 Mar 26 | 31 Mar 2025 | 31 Mar 24 |
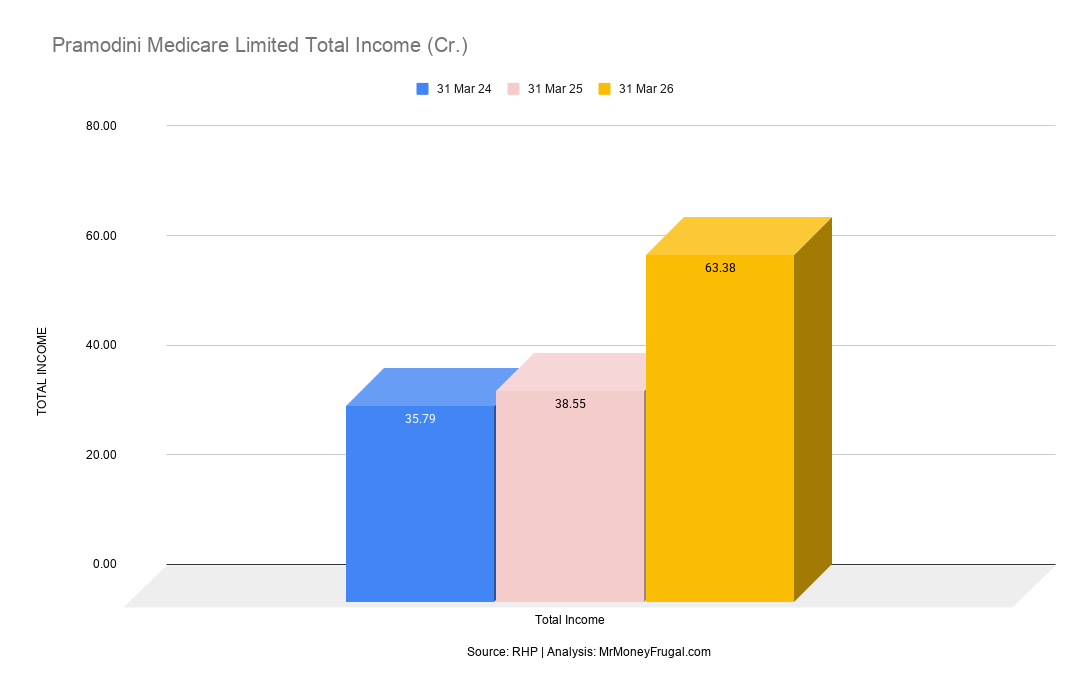
Total Income | 63.38 | 38.55 | 35.79 |
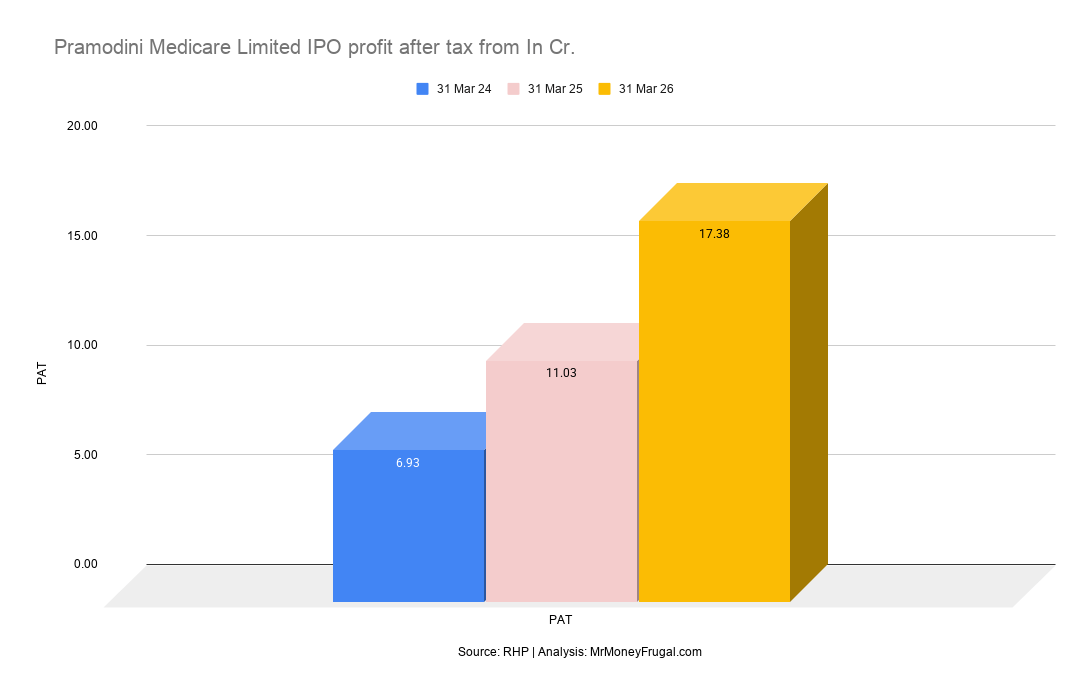
Profit After Tax | 17.38 | 11.03 | 6.93 |
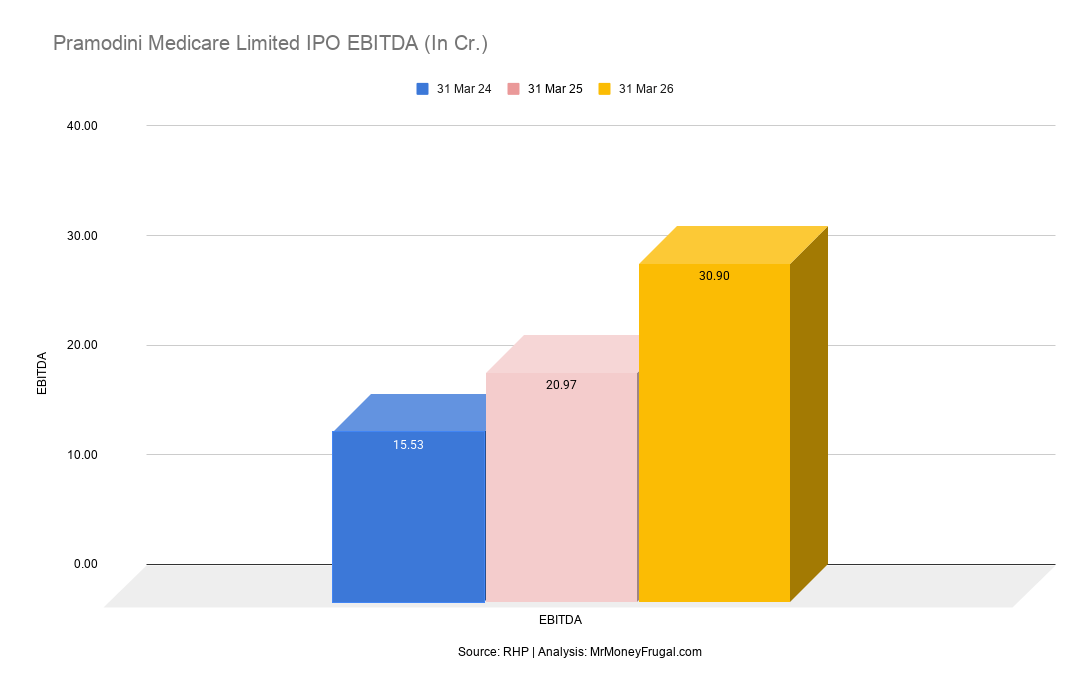
EBITDA | 30.90 | 20.97 | 15.53 |
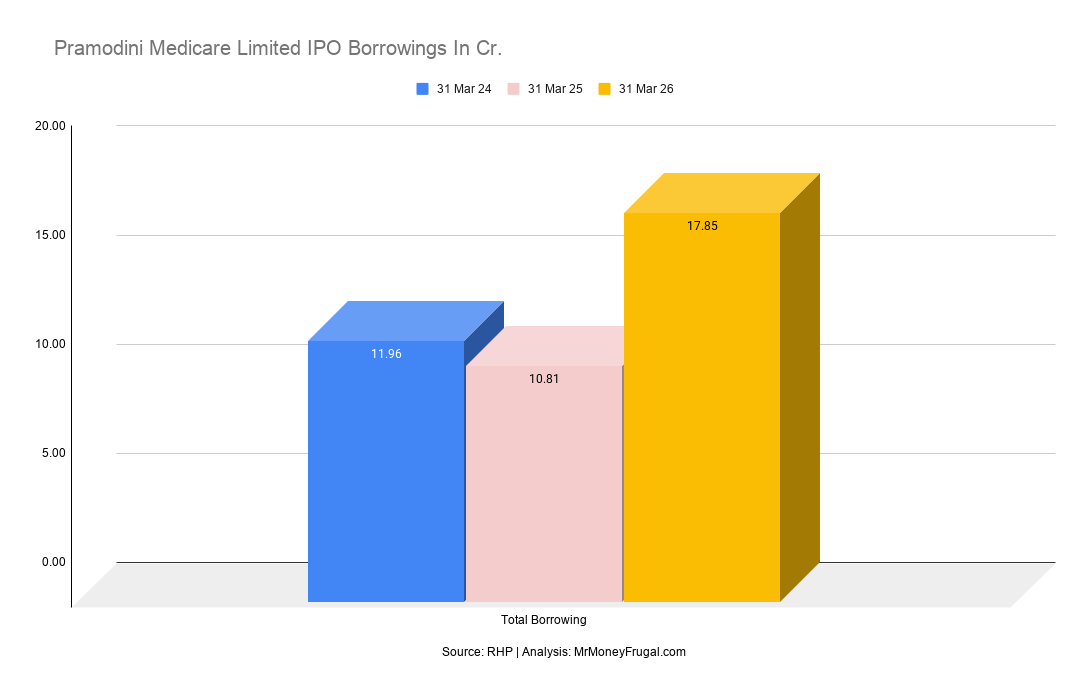
Total Borrowing | 17.85 | 10.81 | 11.96 |
Assets | 93.62 | 56.45 | 48.78 |
Financial Observations
Total Income
The company registered exceptional sequential expansion in its top-line revenue over the last three fiscal years.
- Total income scaled aggressively from ₹35.79 crores in FY24 to ₹63.38 crores in FY26.
- This growth was primarily propelled by a massive volume spike, with radiology tests increasing to over 4.24 lakh scans in FY26.
- Execution of state-backed B2G contracts contributed heavily to this revenue surge.
Profit After Tax
Net profitability experienced substantial growth as operational scale widened and fixed costs were absorbed.
- PAT surged from ₹6.93 crores in FY24 to ₹17.38 crores in FY26.
- The PAT margin improved to a robust 27.90% in the latest fiscal year.
- Expanding teleradiology efficiencies played a crucial role in enhancing bottom-line conversion.
EBITDA
Core operational earnings advanced significantly, reflecting the firm's tremendous pricing power and cost controls.
- EBITDA almost doubled from ₹15.53 crores in FY24 to ₹30.90 crores in FY26.
- The EBITDA margin reached an industry-leading 49.61% during the latest reported fiscal period.
- The high operating leverage inherent in the capital-intensive radiology space supported this margin expansion.
Total Borrowing
The business increased its reliance on external debt to finance the acquisition of expensive medical imaging equipment.
- Total borrowings rose from ₹11.96 crores in FY24 to ₹17.85 crores in FY26.
- Despite the new term loans, the overall Debt-to-Equity ratio remained extremely safe at 0.34x.
- Several of these loans are heavily secured through the personal guarantees of the promoters.
Assets
The overall resource base of the company widened to accommodate its rapidly scaling diagnostic network.
- Total assets expanded dramatically from ₹48.78 crores in FY24 to ₹93.62 crores in FY26.
- This build-up is tied directly to heavy capital expenditures on advanced MRI and CT infrastructure.
- The planned establishment of the new Bangalore centre will further enlarge this physical asset base post-listing.
What Are the P/E ratio and Peer Comparison of Pramodini Medicare Limited?
Factoring in the FY26 EPS of 10.41x against the upper cap price of ₹118, the resulting P/E ratio for Pramodini Medicare is exactly 11.33x.
Check this important report IPO Valuation vs Listing Performance Study 2026
Name of the Company | Total Revenue (₹ Cr) | Face Value (₹) | Basic EPS (₹) | P/E Ratio | RoNW (%) |
Pramodini Medicare Limited | 62.29 | 10 | 10.41 | 11.33 | 32.69 |
Krsnaa Diagnostics Ltd | 772.77 | 5 | 31.30 | 16.74 | 10.35 |
Star Imaging & Path Labs Ltd | 88.53 | 10 | 11.05 | 7.87 | 16.58 |
Invicta Diagnostic Ltd | 32.35 | 10 | 4.90 | 13.62 | 9.76 |
Analysis:
Pramodini Medicare enters the primary market demanding an implied P/E multiple of approximately 11.33x at the upper price band.
When evaluated against listed industry peers like Krsnaa Diagnostics (16.74x) and Invicta Diagnostic (13.62x), the issue appears to be priced competitively.
While operating on a much smaller absolute revenue base (₹62.29 crores) compared to industry giant Krsnaa Diagnostics (₹772.77 crores), Pramodini boasts a significantly superior Return on Net Worth (RoNW) of 32.69% versus Krsnaa's 10.35%.
This high return metric, paired with a stellar EBITDA margin of 49.61%, indicates highly efficient capital utilisation and robust profitability within its specific operational scale.
What is The Industry Outlook of Pramodini Medicare Limited?
Growth potential
- The Indian diagnostic sector is experiencing rapid expansion, driven by increasing health insurance penetration and a growing aging demographic requiring advanced preventive screenings.
- Teleradiology is emerging as a massive growth avenue, allowing companies to bridge the gap between high-tech imaging centers in Tier-2/Tier-3 cities and centralized, specialized radiologists.
- The transition from unorganized local labs to trusted, branded diagnostic chains offers organized players a clear runway for volume consolidation and market share acquisition.
Market trends
- Public-Private Partnerships (PPP) are becoming increasingly common, with state governments outsourcing capital-intensive diagnostic infrastructure (like MRI/CT units) to private operators to improve public healthcare access.
- The industry is highly capital-intensive, requiring continuous, heavy investments in the latest medical imaging technology, which creates significant entry barriers for new players.
- Pricing pressure remains a constant trend, as intense competition and government regulatory caps on specific tests force diagnostic chains to rely heavily on volume growth and operational efficiency to maintain margins.
What Are The Relative Strengths and Potential Risks of Pramodini Medicare IPO?
Strengths:
- Industry-Leading Profitability: The company exhibits an outstanding EBITDA margin of 49.61% and a PAT margin of 27.90% in FY26, significantly outperforming listed peers.
- Asset-Efficient Returns: Demonstrates highly efficient capital use with a Return on Capital Employed (ROCE) of 34.66% and a Return on Net Worth (RoNW) of 32.69%.
- Solid Cash Flows: The firm generates robust liquidity, reporting net cash generated from operations of ₹25.39 crores in FY26.
Risks:
- Segment Concentration: Radiology scans account for an overwhelming 97.05% of operational revenues. Any regulatory pricing caps in this specific segment would severely damage top-line growth.
- High B2G Dependency: Over 61.46% of revenue is Business-to-Government (B2G), tied to Public-Private Partnerships. These contracts are subject to renewal risks and administrative payment delays.
- Customer & Geographic Risk: The Top 1 customer generates 44.17% of overall revenue, and operations are heavily concentrated within the state of Andhra Pradesh.
Key Considerations for Investors
- Customer & Geographic Dependency: A single customer contributes 44.17% to the top line, and operations are heavily concentrated in Andhra Pradesh, exposing the firm to localized regulatory or economic disruptions.
- Segment Concentration: Generating 97.05% of revenue solely from radiology makes the company vulnerable to specific regulatory pricing caps on imaging scans.
- B2G Exposure: Over 61% of revenue relies on government PPP contracts, which often feature stringent renewal protocols and potential administrative payment delays.
- Superior Margins: Despite concentration risks, the company operates with an industry-leading 49.61% EBITDA margin and a 32.69% RoNW, supported by efficient teleradiology scaling.
Key Takeaways
- IPO Price Band: ₹110 to ₹118 per equity share
- Lot Size: 1,200 shares (Minimum retail application of ₹2,83,200 for 2 lots)
- Allotment Date: Allotment on 17 August 2026
- Listing Dates: Listing on NSE SME on 19 August 2026
Resources related to IPO
1. Upcoming & Live IPOs in India
2. IPO Allotment Status – How to Check Allotment Status of IPO Shares
3. Latest IPO Subscription Status Today
4.IPO Glossary: 100+ Important Terms Every Investor Should Know
6. July 2026 IPO Review: 33 IPOs, ₹21140.52 Cr Raised & 56.37x Average Subscription
FAQs on Pramodini Medicare IPO
How is the Pramodini Medicare IPO trading in the informal grey market today?
Monitor current premium adjustments for this SME IPO on our central hub page, noting that unofficial indicators fluctuate daily according to changing market demand.
What is Pramodini Medicare IPO price band?
The corporate issuer has locked the equity valuation limits between ₹110 and ₹118 per individual share.
What is Pramodini Medicare IPO allotment date?
Investors can expect the share allotment structure to be officially approved on 17 August 2026.
How to check Pramodini Medicare IPO allotment status?
After the share allocation process concludes, market participants can review their allotment on the online portal of the registrar, Purva Sharegistry (India) Pvt. Ltd., by providing their PAN or application number.
What is Pramodini Medicare IPO listing date?
The official date set for the commencement of share market operations on the NSE SME index is 19 August 2026.
Investment Perspective on Pramodini Medicare IPO
Pramodini Medicare’s IPO presents a high-margin, asset-efficient play on India's healthcare diagnostics sector, boasting a stellar 49.61% EBITDA margin and 34.66% ROCE.
However, seasoned stock pickers must balance these superior financial metrics against deep operational vulnerabilities.
Revenues remain highly concentrated, with radiology contributing 97.05% and a single client generating 44.17%.
Furthermore, over 61% of overall operations depend on B2G arrangements, creating key regulatory and severe working capital payment delay risks.
Disclaimer: The information provided offers general financial analysis and lacks personal investment advice. It is essential to receive clearance from a SEBI-certified professional prior to undertaking any trading activities.
