
Manipal Health Enterprises Limited (MHEL) is India’s largest private multispecialty hospital network by bed capacity, providing comprehensive healthcare services across the nation.
The company boasts 13,037 licensed beds spread across 49 hospitals, leading the market in major metropolitan areas like Bengaluru, Kolkata, and Pune.
Transitioning to the public markets, the Manipal Health Enterprises IPO opens for subscription on July 29, 2026, and is scheduled to close on July 31, 2026. Through this mainboard offering on the BSE and NSE, the firm aims to raise massive capital via a fresh issue of ₹8,000 crores and an Offer for Sale (OFS) of 2,16,13,834 equity shares. Track all the mainboard IPOs at our IPO calendar.
The price band is fixed at ₹560 to ₹590 per share, with a minimum retail bidding lot of 25 shares.
This article provides the current Grey Market Premium (GMP) for the Manipal Health Enterprises IPO, along with its subscription status, allotment date, price band, and a full review.
Briefs of Manipal Health Enterprises IPO Details
- Price Band: ₹560 – ₹590 per share (Employee Discount: ₹56.00)
- IPO Open / Close Dates: 29 July 2026 / 31 July 2026
- Lot Size: 25 shares (Minimum Bid: 25 shares)
- Issue Size: Fresh Issue of ₹8,000.00 crores + OFS of 2,16,13,834 shares
- Registrar: KFin Technologies Ltd.
- Listing Exchange: BSE, NSE
IPO Reservation
- Face value: ₹2 per share
- Anchor offer: Up to 60% of the QIB Portion
- QIB-shares: Not less than 75% of the Net Offer
- NIIs-Shares offered: Not more than 15% of the Net Offer
- RIIs- Shares offered: Not more than 10% of the Net Offer
What is Today's Grey Market Premium (GMP) for the Manipal Health Enterprises IPO?
Our GMP tracker allows you to monitor daily GMP trends for this and various other corporate listings.
Be aware that these rates are unofficial indicators based entirely on private demand shifts; they change daily and are not monitored or endorsed by SEBI, the NSE, or the BSE.
What is the Official Schedule and Allotment Timeline for the Manipal Health Enterprises IPO?
- IPO Open & Close Date: 29 July 2026 to 31 July 2026
- Basis of Allotment Date: 3 August 2026
- Refund Initiation Date: 4 August 2026
- Credit of Shares: 4 August 2026
- Listing Date: 5 August 2026
What Are The Stated Objectives of Manipal Health Enterprises IPO?
Manipal Health Enterprises plans to use the net funds raised from this new share sale for the following main goals:
- Debt Repayment: A massive allocation of ₹5,552.75 crores will be utilised to prepay Non-Convertible Debentures (NCDs) originally issued to fund the Sahyadri acquisition, drastically reducing ongoing interest expenses.
- Stake Acquisition: An estimated ₹574.00 crores is directed towards acquiring a minority stake in its stepdown subsidiary, Sahyadri Hospitals Private Limited.
- General Corporate Purposes: To support routine business activities and corporate growth, the company will direct the remaining balance, capped at 25% of the total gross earnings, into operational and expansion accounts.
Also Check: 25 Mainboard IPOs: GMP vs Actual Listing Performance – A Data Study
How has Manipal Health Enterprises performed Financially in recent years?
The table below summarizes the company's financial history, with all figures shown in crores of rupees.
Also learn: IPO Listing Performance Tracker 2026 – Complete Dataset of IPO Listing Gains in India
Period Ended | 31 Mar 26 | 31 Mar 2025 | 31 Mar 24 |
Total Income | 10,520.52 | 8,362.79 | 6,265.17 |
Profit After Tax | 916.52 | 1,081.67 | 533.20 |
EBITDA | 2,795.94 | 2,247.07 | 1,776.60 |
Total Borrowing | 10,553.43 | 4,766.83 | 3,943.98 |
Assets | 24,864.50 | 14,072.08 | 10,818.83 |
Source: RHP
Financial Observations
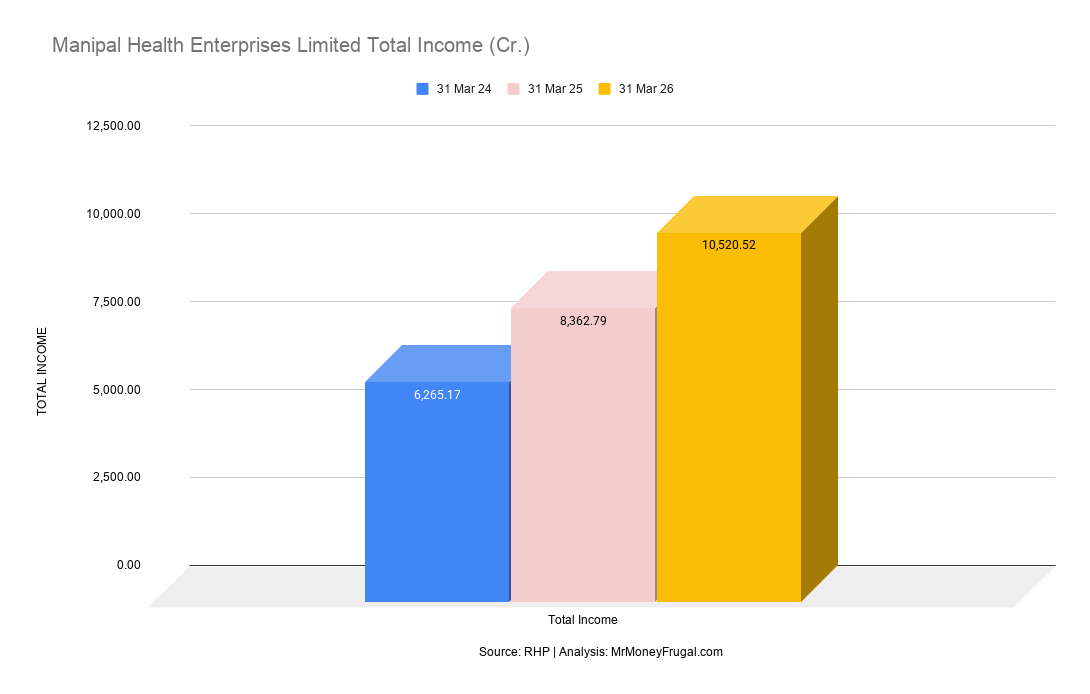
Total Income
The company registered exceptional top-line progression driven heavily by an aggressive inorganic expansion strategy.
- Total income scaled massively from ₹6,265.17 crores in FY24 to ₹10,520.52 crores in FY26.
- Acquisitions of regional networks like AMRI, Medica Synergie, and Sahyadri Hospitals fueled this growth.
- Increased volumes in high-acuity CONGO-R specialties also commanded higher pricing and realisations.
Profit After Tax
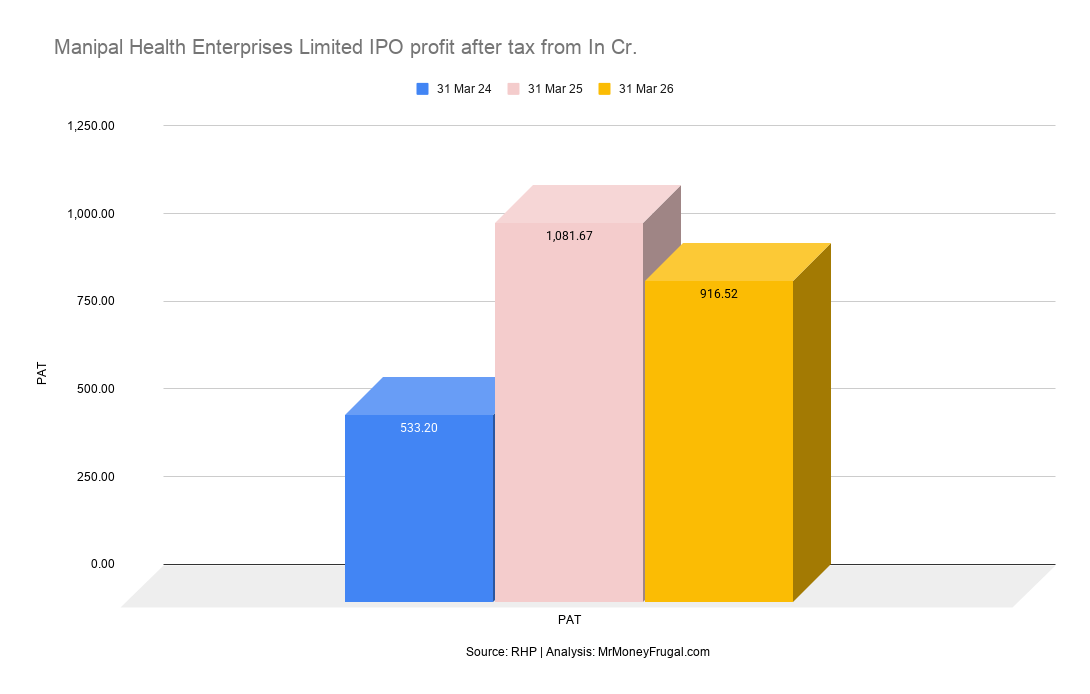
Net profit experienced a temporary contraction in the latest fiscal year despite soaring revenues.
- PAT surged initially to ₹1,081.67 crores in FY25 but dipped to ₹916.52 crores in FY26.
- This contraction was primarily caused by higher deferred tax expenses and exceptional integration charges.
- Despite the dip, the core hospital business remains fundamentally strong with an 8.87% net margin.
EBITDA
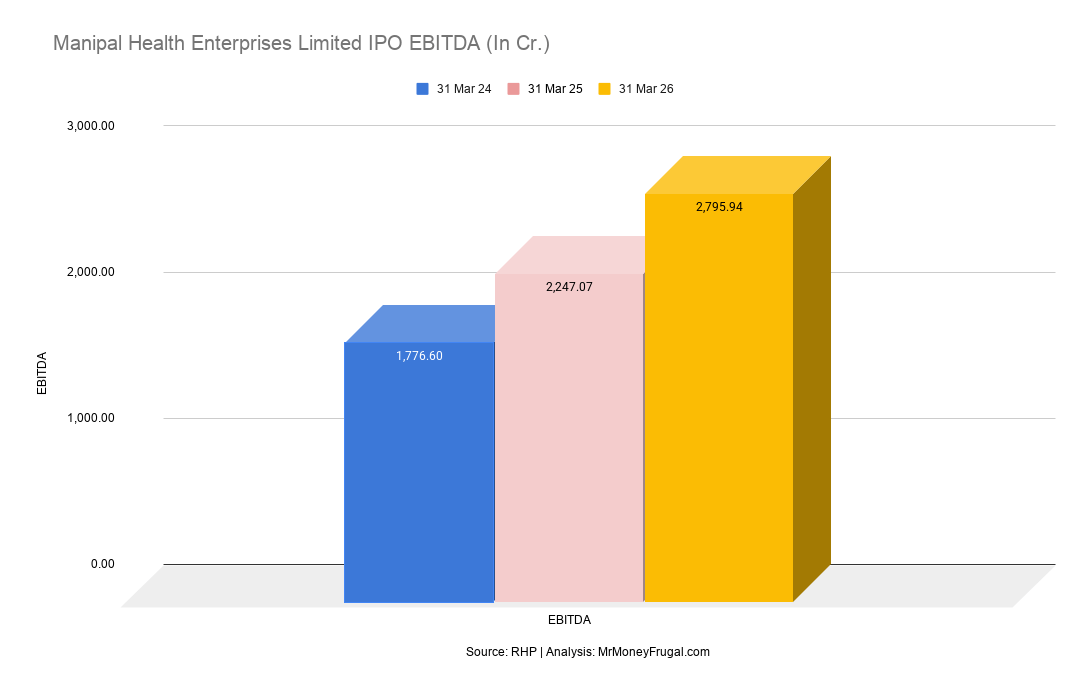
Core operational earnings showcased robust stability as the company efficiently integrated its newly acquired assets.
- EBITDA expanded consistently, reaching ₹2,795.94 crores in FY26 from ₹1,776.60 crores in FY24.
- The EBITDA margin stood at an impressive 27.05% in the latest fiscal year.
- Effective negative working capital cycle management supported these high cash-generative margins.
Total Borrowing
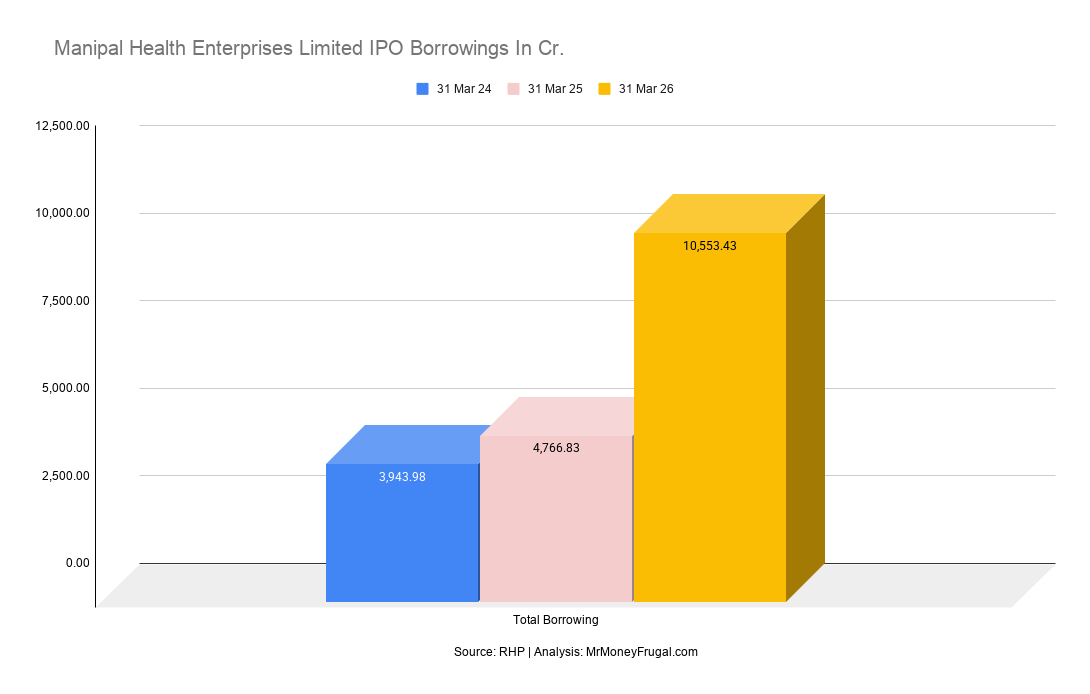
The firm aggressively utilized external debt to fund its rapid consolidation and acquisition spree across India.
- Total borrowings ballooned to ₹10,553.43 crores in FY26, up from ₹3,943.98 crores in FY24.
- This led to an elevated Net Debt to Adjusted EBITDA ratio of 3.74x.
- The primary objective of this IPO is to deploy ₹5,552.75 crores to dramatically deleverage this balance sheet.
Assets
The overall resource base of the company expanded exponentially, mirroring its strategy of acquiring established regional hospital chains.
- Total assets surged to ₹24,864.50 crores in FY26 from ₹10,818.83 crores in FY24.
- A substantial portion of this involves capitalised property and advanced medical equipment.
- Massive goodwill (₹8,120.56 crores) is also recorded, reflecting the premium paid to instantly capture competitive regional market shares.
What Are the P/E ratio and Peer Comparison of Manipal Health Enterprises Limited?
The P/E ratio evaluates a company's stock value by dividing its current price by its profit per share to show what buyers pay per rupee of profit.
Based on its highest target price of ₹590 and an FY26 basic profit per share of ₹7.71, Manipal Health Enterprises enters the market with a P/E ratio of 76.52.
Name of the company | Face value (₹) | Revenue from operations (₹ Cr) | Basic EPS (₹) | P/E Ratio | RoNW (%) | NAV (₹) |
Manipal Health Enterprises | 2 | 10,335.75 | 7.71 | 76.52 | 10.57 | 72.55 |
Apollo Hospitals Enterprise Ltd | 5 | 25,228.50 | 135.04 | 66.15 | NA | NA |
Fortis Healthcare Ltd | 10 | 9,127.84 | 13.80 | 70.22 | NA | NA |
Max Healthcare Institute Ltd | 10 | 10,065.00 | 14.83 | 74.55 | NA | NA |
The required figures are marked 'NA' (Not Available) because they were missing from the audited reports, annual reviews, and official websites of the listed peer companies.
Analysis:
Manipal Health Enterprises enters the primary market demanding an implied P/E multiple of approximately 76.52x at the upper price band.
When evaluated against listed healthcare giants, Apollo Hospitals dominates the group with a massive revenue base of ₹25,228.50 crores and a P/E of 66.15x.
Manipal Health ranks second in revenue (₹10,335.75 crores), marginally overtaking Max Healthcare (₹10,065.00 crores) and Fortis Healthcare (₹9,127.84 crores).
While Manipal's EPS is the lowest in the group, it commands a slight premium over Max Healthcare's 74.55x P/E.
This lofty valuation reflects the market's strong appetite for scalable, organized hospital chains boasting industry-leading bed capacities.
What is The Industry Outlook of Manipal Health Enterprises?
Growth potential
- The Indian healthcare delivery sector is witnessing robust secular growth, driven by increasing insurance penetration and an aging demographic requiring specialized tertiary care.
- Organised hospital chains are uniquely positioned to capture this demand through aggressive inorganic expansion and the consolidation of fragmented regional markets.
- Higher realisations from high-acuity specialties (like oncology and cardiac care) continue to push Average Revenue Per Occupied Bed (ARPOB) upwards.
Market trends and competitors
- The market features intense competition among top-tier corporate hospital networks (like Apollo, Max, and Fortis) striving for dominance in key metropolitan regions.
- Success increasingly relies on maintaining an efficient case mix, reducing Average Length of Stay (ALOS), and managing negative working capital cycles.
- Valuations across the sector remain at a premium (average P/E of 70.31x), reflecting strong institutional investor confidence in the scalability of these capital-intensive, high-margin business models.
What Are The Strengths and Risks of Manipal Health Enterprises IPO ?
Strengths:
- Market Leadership: The company operates as the largest private hospital chain in India by bed capacity (13,037 beds) and leads the market in Bengaluru, Kolkata, and Pune.
- High-Acuity Specialty Mix: Over 64% of gross inpatient revenue in FY26 came from "CONGO-R" specialties, commanding higher realisations and margins.
- Consolidation Playbook: A proven track record of acquiring and turning around major regional assets, adding 5,548 beds through acquisitions between FY21 and FY26.
Risks:
- Geographic Concentration: Approximately 46.40% of the firm's revenue in FY26 was derived strictly from its hospitals located in Karnataka.
- High Debt Levels: Aggressive acquisitions pushed outstanding borrowings to ₹11,185.02 crores by May 2026, creating a highly leveraged balance sheet.
- Integration and Impairment: Integrating massive acquisitions resulted in ₹8,120.56 crores of goodwill on the balance sheet, exposing the firm to future impairment charges (e.g., ₹114.06 crores impaired in FY24).
Key Considerations for Investors
- Debt Deleveraging: The primary objective of the fresh issue is to deploy ₹5,552.75 crores to prepay NCDs associated with recent acquisitions, which will dramatically lower ongoing finance costs and improve net margins.
- Geographic Dependency: Despite its pan-India presence, the company's financial performance remains heavily skewed, with 46.40% of FY26 revenue originating solely from its Karnataka facilities.
- Goodwill Impairment Risk: An aggressive inorganic growth strategy has loaded the balance sheet with ₹8,120.56 crores in goodwill, creating exposure to significant non-cash impairment charges if acquired assets underperform.
- Premium Valuation: At the upper band, the company demands a P/E of ~76.52x, pricing it at a premium even against established giants like Max Healthcare (74.55x) and Apollo Hospitals (66.15x).
More Important IPO Resources:
1. IPO Allotment Status – How to Check Allotment Status of IPO Shares
3. IPO GMP vs Listing Accuracy Study 2026
4. Latest IPO Subscription Status Today | Live Updates
5. June 2026 IPO Review: 22 IPOs, ₹2,502 Cr Raised & 75.98x Average Subscription
Key Takeaways
- IPO Price Band: ₹560 to ₹590 per equity share
- Lot Size: 25 shares (Minimum retail investment of ₹14,750)
- Allotment Date: Allotment on 3 August 2026
- Listing Date: Listing on BSE and NSE on 5 August 2026
FAQs on Manipal Health Enterprises IPO
What is the GMP of the Manipal Health Enterprises IPO today?
Our dedicated tracking portal provides daily GMP updates for this mainboard issue, reflecting how informal market demand shifts day to day with changing market situations.
What is the set subscription price bracket per share for Manipal Health Enterprises?
The price band has been fixed at ₹560 to ₹590 per equity share, with a ₹56 discount for eligible employees.
When is the scheduled announcement for the Manipal Health Enterprises share allocation results?
Based on the official timeline, the tracking data for successful share allocations will be established on August 3, 2026.
Where can you check your share allocation status for the Manipal Health Enterprises IPO?
Once the allocation is complete, investors can check if they received shares by visiting the website of the registrar, KFin Technologies Ltd., or the official tracking portals of the BSE and NSE, and entering their PAN or application number.
On what date will Manipal Health Enterprises shares start trading on the stock exchanges?
The official debut for these shares on the BSE and NSE platforms is scheduled for August 5, 2026.
Investment Perspective on Manipal Health Enterprises IPO
Manipal Health Enterprises offers a compelling growth story as India's largest hospital network with 13,037 beds.
Driven by aggressive acquisitions and a high-margin CONGO-R specialty mix, revenue grew at an impressive 29.41% CAGR.
While debt-funded expansion elevated its Net Debt/EBITDA to 3.74x, utilizing ₹55,527.59 million of IPO proceeds to retire debt will drastically improve the balance sheet.
Investors must, however, weigh premium sector valuations and geographic concentration risks in Karnataka.
Disclaimer:
This content serves as a general overview and should not be taken as individual investment guidance. Investors are urged to seek advice from a SEBI-certified professional before trading.
