
Updated on 23.08.2026
GMP does not guarantee listing gains.
It is just an unofficial and unregulated indicator. Yet many investors apply for IPOs mainly based on Grey Market Premium (GMP).
But how accurate is it really?
In this analysis, we have studied 62 Mainboard IPOs in the Indian markets and compared their Grey Market Premium with their actual listing performance to understand how closely GMP predictions matched the final listing prices.
This GMP vs Actual Listing Price data clears many doubts for investors who rely heavily on GMP before applying for an IPO subscription.
So, let us move ahead and begin with a basic understanding of GMP.
You can track GMP of all live IPOs on our GMP Today hub page, which is updated regularly. You may also find our article “10 IPOs with Highest GMP” useful if you want to understand GMP behaviour more closely.

What is GMP?
GMP or Grey Market Premium is an unofficial price which is often quoted or traded in the grey market before listing. It comes from unofficial or unregulated markets, and that is why it is called Grey Market Premium. (GMP is not regulated by NSE/BSE/SEBI OR MCA)
For example, in an IPO of Fractal Analytics, the GMP was ₹180, then it went as high as ₹197, and later turned negative at ₹–28. Whether it will go up or down from here, nobody can actually predict it precisely.
How this GMP Analysis is Done: Methodology
In this analysis:
- Only Mainboard IPOs are included.
- The last GMP available before listing is considered.
- Based on the last GMP, we calculated the expected listing price.
- Then the GMP-based expected price and the actual listing price are compared.
- IPOs are categorised into:
- IPOs where listing price beat GMP
- IPOs that underperformed GMP
- IPOs that listed in line with or very close to GMP
GMP data is taken from publicly available sources and from the GMP data on our GMP Today hub page.
GMP vs Listing Performance: Data Overview
| Sl No | IPO Name | Issue Price | Last GMP | GMP % | Expected Price | Listing Price | Listing % | Variation |
|---|---|---|---|---|---|---|---|---|
| 1 | Nephrocare Health Services | 460 | 40 | 8.70 | 500 | 490 | 6.52 | -10 |
| 2 | Vidya Wires | 52 | 3.5 | 6.73 | 55.5 | 52.13 | 0.25 | -3.37 |
| 3 | Capillary Technologies | 577 | 55 | 9.53 | 632 | 560 | -2.95 | -72 |
| 4 | Studds Accessories | 585 | 35 | 5.98 | 620 | 565 | -3.42 | -55 |
| 5 | Orkla India | 730 | 66 | 9.04 | 796 | 750 | 2.74 | -46 |
| 6 | Hexagon Nutrition | 45 | 4 | 8.89 | 49 | 48.25 | 7.22 | -0.75 |
| 7 | Gujarat Kidney and Super Speciality | 114 | 1.5 | 1.32 | 115.5 | 120 | 5.26 | 4.5 |
| 8 | KSH International | 384 | -2 | -0.52 | 382 | 399 | 3.91 | 17 |
| 9 | Park Medi World | 162 | 0 | 0.00 | 162 | 158.8 | -1.98 | -3.2 |
| 10 | Wakefit Innovations | 195 | 4 | 2.05 | 199 | 194.1 | -0.46 | -4.9 |
| 11 | Shadowfax Technologies | 124 | -3.5 | -2.82 | 120.5 | 112.6 | -9.19 | -7.9 |
| 12 | Amagi Media Labs | 361 | -1 | -0.28 | 360 | 318 | -11.91 | -42 |
| 13 | Aequs | 124 | 24 | 19.35 | 148 | 140 | 12.90 | -8 |
| 14 | Corona Remedies | 1062 | 342.5 | 32.25 | 1404.5 | 1470 | 38.42 | 65.5 |
| 15 | Excelsoft Technologies | 120 | 4 | 3.33 | 124 | 135 | 12.50 | 11 |
| 16 | ICICI Prudential AMC | 2165 | 460 | 21.25 | 2625 | 2600 | 20.09 | -25 |
| 17 | Fujiyama Power Systems | 228 | 0.5 | 0.22 | 228.5 | 222 | -2.63 | -6.5 |
| 18 | Meesho | 111 | 42 | 37.84 | 153 | 161.2 | 45.23 | 8.2 |
| 19 | Bharat Coking Coal (BCCL) | 23 | 18.5 | 80.43 | 41.5 | 45 | 95.65 | 3.5 |
| 20 | Emmvee Photovoltaic | 217 | 0 | 0.00 | 217 | 217 | 0.00 | 0 |
| 21 | Pine Labs | 221 | 5.5 | 2.49 | 226.5 | 242 | 9.50 | 15.5 |
| 22 | Groww | 100 | 5 | 5.00 | 105 | 112 | 12.00 | 7 |
| 23 | Lenskart Solutions | 402 | 10 | 2.49 | 412 | 390 | -2.99 | -22 |
| 24 | Sudeep Pharma | 593 | 121 | 20.40 | 714 | 730 | 23.10 | 16 |
| 25 | Tenneco Clean Air | 397 | 104 | 26.20 | 501 | 498 | 25.44 | -3 |
| 26 | Gaudium IVF | 79 | 0 | 0.00 | 79 | 83 | 5.06 | 4 |
| 27 | Fractal Analytics | 900 | -28 | -3.11 | 872 | 876 | -2.67 | 4 |
| 28 | Aye Finance | 129 | -2 | -1.55 | 127 | 129 | 0.00 | 2 |
| 29 | Clean Max Enviro Energy | 1,053 | -35 | -3.32 | 1,018 | 960 | -8.83 | -58 |
| 30 | Shree Ram Twistex | 104 | -28 | -26.92 | 76 | 68 | -34.62 | -8 |
| 31 | Central Mine Planning & Design Institute Limited (CMPDIL) | 172 | 4 | 2.33 | 176 | 160 | -6.98 | -16 |
| 32 | GSP Crop Science | 320 | 2 | 0.63 | 322 | 328 | 2.50 | 6 |
| 33 | Raajmarg Infra InvIT | 100 | 3.5 | 3.50 | 103.5 | 107 | 7.00 | 3.5 |
| 34 | Innovision | 548 | -85 | -15.51 | 463 | 467.7 | -14.65 | 4.7 |
| 35 | Rajputana Stainless | 122 | 3 | 2.46 | 125 | 122 | 0.00 | -3 |
| 36 | Sedemac Mechatronics | 1,352 | 0 | 0.00 | 1,352 | 1535 | 13.54 | 183 |
| 37 | Omnitech Engineering | 227 | 0 | 0.00 | 227 | 202 | -11.01 | -25 |
| 38 | PNGS Reva Diamond Jewellery | 386 | -20 | -5.18 | 366 | 375 | -2.85 | 9 |
| 39 | Citius TransNet InvIT | 100 | 4 | 4.00 | 104 | 104.6 | 4.60 | 0.6 |
| 40 | Om Power Transmission | 175 | 4 | 2.29 | 179 | 186 | 6.29 | 7 |
| 41 | Amir Chand Jagdish Kumar (Exports) Limited | 212 | 2 | 0.94 | 214 | 200 | -5.66 | -14 |
| 42 | Sai Parenteral’s | 392 | 0 | 0.00 | 392 | 400 | 2.04 | 8 |
| 43 | Powerica | 395 | 0 | 0.00 | 395 | 366 | -7.34 | -29 |
| 44 | Bagmane Prime Office REIT | 100 | 4 | 4.00 | 104 | 103.5 | 3.50 | -0.5 |
| 45 | Physicswallah | 109 | 14 | 12.84 | 123 | 143.1 | 31.28 | 20.1 |
| 46 | Kissht | 171 | 22 | 12.87 | 193 | 190 | 11.11 | -3 |
| 47 | CMR Green Technologies | 192 | 67 | 34.90 | 259 | 268 | 39.58 | 9 |
| 48 | Turtlemint Fintech | 152 | -5 | -3.29 | 147 | 134.9 | -11.25 | -12.1 |
| 49 | Laser Power & Infra | 214 | 39 | 18.22 | 253 | 250 | 16.82 | -3 |
| 50 | Kusumgar | 419 | 161 | 38.42 | 580 | 569 | 35.80 | -11 |
| 51 | Knack Packaging | 170 | 8.5 | 5.00 | 178.5 | 188 | 10.59 | 9.5 |
| 52 | Astha Spintex | 136 | 4 | 2.94 | 140 | 130 | -4.41 | -10 |
| 53 | CSM Technologies | 113 | 0 | 0.00 | 113 | 113 | 0.00 | 0 |
| 54 | Cordelia Cruises | 808 | -51 | -6.31 | 757 | 681 | -15.72 | -76 |
| 55 | Advit Jewels | 138 | 50 | 36.23 | 188 | 188.9 | 36.88 | 0.9 |
| 56 | Xtranet Technologies | 127 | 14 | 11.02 | 141 | 136 | 7.09 | -5 |
| 57 | Indo-MIM | 485 | 184 | 37.94 | 669 | 700 | 44.33 | 31 |
| 58 | Lohia Corp | 425 | 17 | 4.00 | 442 | 461 | 8.47 | 19 |
| 59 | Cube Highways Trust InvIT | 152 | 2 | 1.32 | 154 | 155 | 1.97 | 1 |
| 60 | Caliber Mining and Logistics | 424 | 60 | 14.15 | 484 | 500.25 | 17.98 | 16.25 |
| 61 | Alpine Texworld | 105 | 1 | 0.95 | 106 | 105 | 0.00 | -1 |
| 62 | SBI Funds Management | 574 | 65 | 11.32 | 639 | 613.3 | 6.85 | -25.7 |
Now is the time to break down what the numbers of the table reveal.
Snapshot of the GMP Performance of the IPOs
Total IPOs analysed: 62
IPOs with GMP signal: 54
IPOs without GMP signal: 8 (Where GMP was 0)
IPOs that beat GMP: 25 (46.29%)
IPOs that underperformed GMP: 29 (53.70%)
Directional Accuracy: 77.78%
IPOs listed in line with GMP: 0
So, only 46.29% of IPOs beat GMP expectations, while 53.7% underperformed GMP expectations.
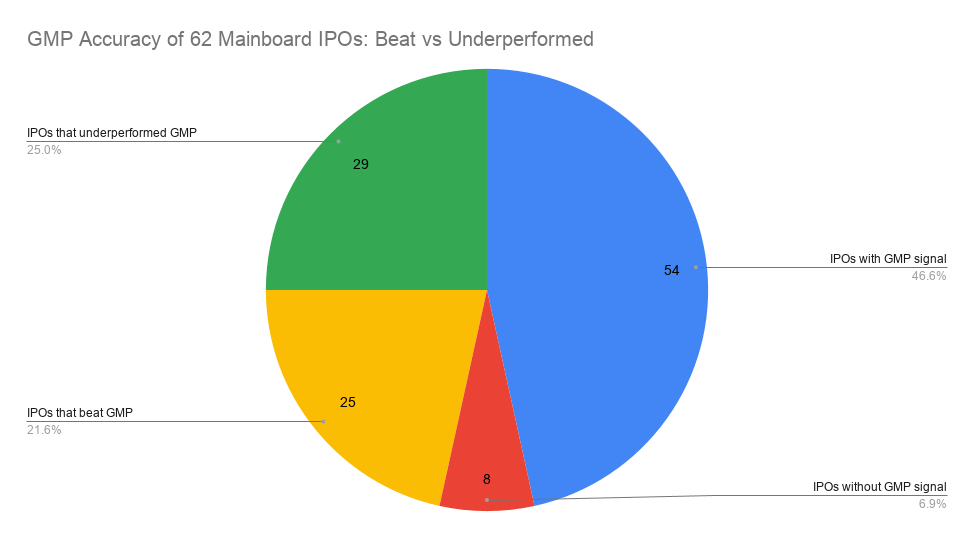
GMP Accuracy of Mainboard IPOs: Beat vs Underperformed
Pattern Analysis: What These GMP Numbers Narrate
1. GMP Percentage-Based Analysis
A) Performance of High GMP IPOs (≥10%)
Total IPO-17
IPOs that beat GMP: 9 (52.94%)
IPOs that underperformed GMP: 8 (47.06%)
IPOs listed in line with GMP=0
Avg GMP %= 27.39%
GMP Directional Accuracy: 100%
High GMP IPOs showed 100% directional accuracy, but only 52.94% beat the GMP-implied price, indicating GMP was highly reliable for direction but less reliable for predicting the magnitude of listing gains.
B) Performance of Moderate GMP IPOs (>5–10%)
Total IPOs: 6
IPOs that beat GMP: 0
IPOs that underperformed GMP: 6 (100%)
IPOs listed in line with GMP: 0
Avg GMP %= 8.15%
Directional Accuracy: 66.67%
Moderate GMP IPOs were the weakest-performing band, with 0 of 6 beating GMP expectations, although GMP still achieved 66.67% directional accuracy.
C) Performance of Low / Neutral GMP IPOs (>0 <=5%)
Total IPOs: 20
IPOs that beat GMP: 11 (55%)
IPOs that underperformed GMP: 9 (45%)
IPOs listed in line with GMP: 0
Avg GMP %= 2.56%
Directional Accuracy: 60%
Low/Neutral GMP IPOs delivered a 55% beat rate with 60% directional accuracy, indicating a relatively mixed but modestly useful GMP signal at lower premium levels.
D) IPOs with Negative GMP
Total IPOs: 11
IPOs that beat GMP: 5 (45.45%)
IPOs that underperformed GMP: 6 (54.54%)
IPOs listed in line with GMP: 0
Avg GMP %= -6.26%
Directional Accuracy: 81.81%
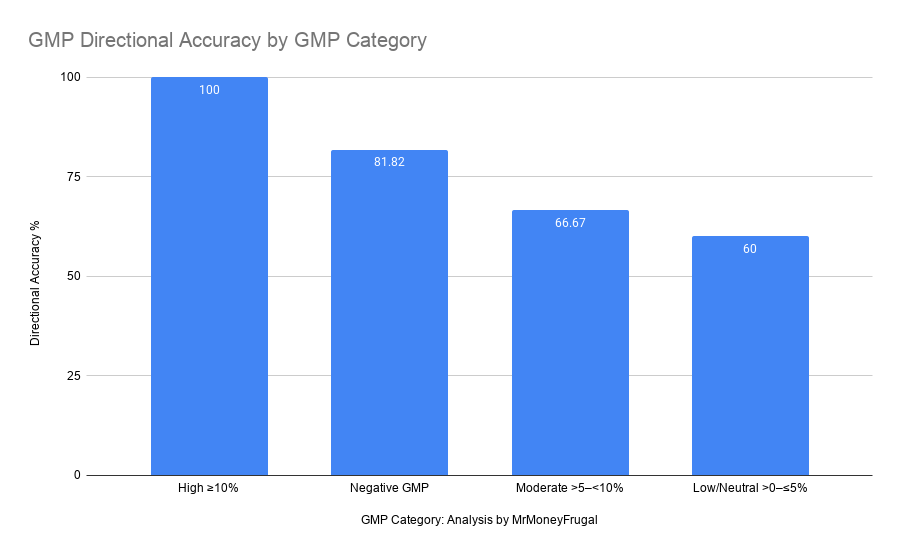
High GMP IPOs recorded the highest directional accuracy at 100%, followed by negative GMP IPOs at 81.82%, moderate GMP at 66.67%, and low/neutral GMP at 60%.
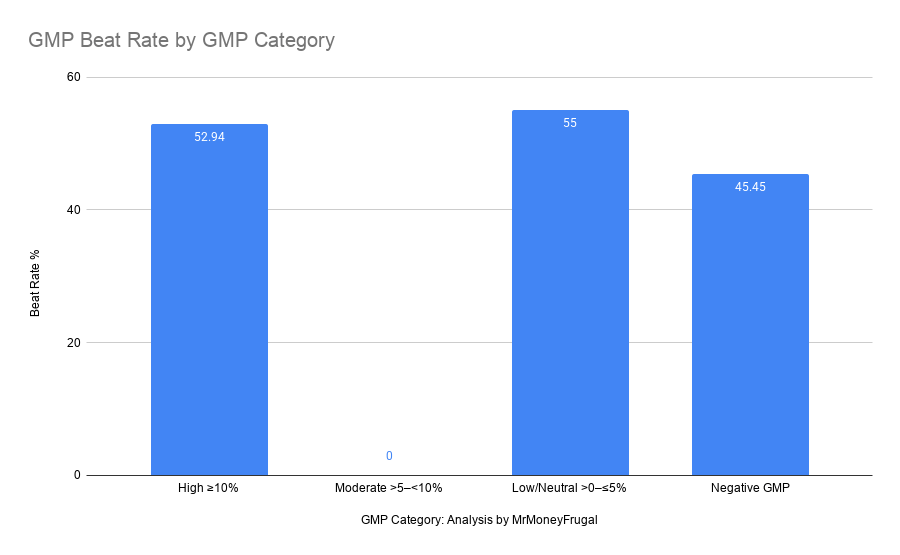
High GMP IPOs had a 52.94% GMP beat rate, while low/neutral GMP IPOs recorded 55%. Moderate GMP IPOs had a 0% beat rate and negative GMP IPOs had a 45.45% beat rate.
Negative GMP IPOs showed 81.81% directional accuracy, but only 45.45% beat the GMP-implied price, indicating GMP was more reliable in predicting direction than the magnitude of the listing outcome.
2. Issue Size vs Accuracy
Large IPO- Issue Size >3000 Cr
IPOs with GMP signal: 13 IPOs without GMP signal: 0
IPOs that beat GMP: 7 (53.85%)
IPOs that underperformed GMP: 6 (46.15%)
IPOs listed in line with GMP: 0
Avg GMP %: 12.53%
Directional Accuracy: 92.31% (12/13)
Large IPOs showed 92.31% directional accuracy and a 53.85% GMP beat rate, indicating GMP was highly reliable for predicting listing direction but less reliable in estimating the actual listing premium.
Mid Size IPOs- Issue Size >1000 Cr. but less than <3000 Cr.
Total IPOs: 13
IPOs with GMP signal: 10
IPOs without GMP signal: 3
IPOs that beat GMP: 5 (50.00%)
IPOs that underperformed GMP: 5 (50.00%)
IPOs listed in line with GMP: 0
Avg GMP %: 9.41%
Directional Accuracy: 70.00% (7/10)
The 3 no-signal IPOs are:
- Emmvee Photovoltaic — GMP ₹0
- Sedemac Mechatronics — GMP ₹0
- Powerica — GMP ₹0
These are not included in the 5/5 GMP accuracy calculation or 7/10 directional accuracy.
Mid-size IPOs showed a 50% GMP beat rate and 70% directional accuracy, suggesting GMP had moderate predictive value, while the 3 IPOs without GMP signals were excluded from the accuracy calculations.
Small IPOs (< ₹1,000 Cr)
Total IPOs:
36
IPOs with GMP signal:
31
IPOs without GMP signal:
5
IPOs that beat GMP:
13 (41.94%)
IPOs that underperformed GMP:
18 (58.06%)
IPOs listed in line with GMP:
0
Avg GMP %:
7.74%
Directional Accuracy:
74.19% (23/31)
Small IPOs had a 41.94% GMP beat rate, while GMP correctly predicted the direction of listing in 74.19% of cases, indicating stronger directional reliability than GMP-implied price accuracy.
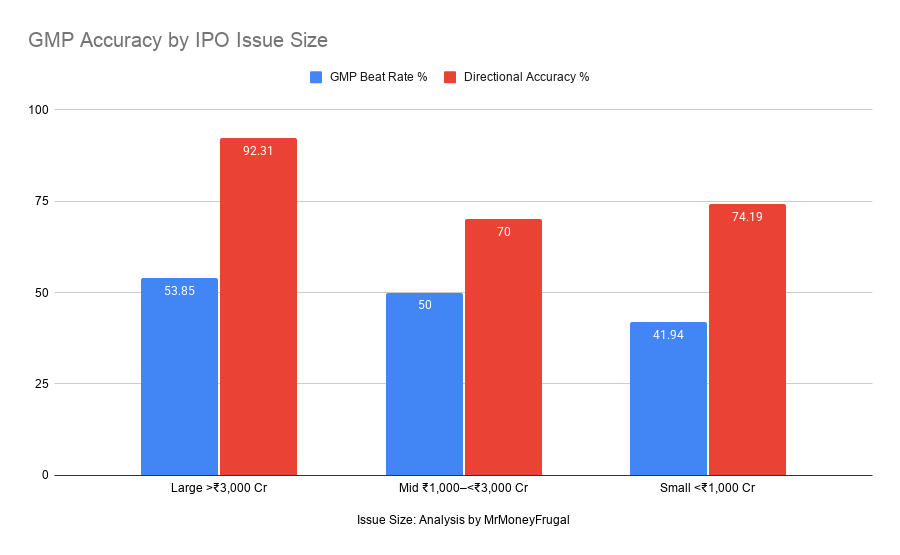
Large IPOs recorded the highest directional accuracy at 92.31%, while their GMP beat rate was 53.85%. Mid-size IPOs recorded 70% directional accuracy and a 50% beat rate, while small IPOs recorded 74.19% directional accuracy and a 41.94% beat rate.
Key Takeaway
GMP was strongly associated with actual listing gains, with a 0.9584 Pearson correlation in our 54-IPO sample. However, GMP was more reliable for predicting listing direction (77.78% directional accuracy) than for predicting the exact listing outcome, with only 46.29% of IPOs beating GMP expectations.
Important IPO Resources:
2. IPO GMP vs Listing Accuracy Study 2026
3. IPO Valuation vs Listing Performance Study 2026
4. IPO Listing Performance Tracker 2026 – Complete Dataset of IPO Listing Gains in India
5. IPO Glossary
7. Daywise IPO subscription details
8. GMP vs Listing Gains July 2026 IPOs: A Data Analysis of 34 IPOs
FAQ
1. Is GMP a reliable indicator of IPO listing gains?
Based on our analysis of 54 IPOs with a GMP signal, 25 IPOs (46.29%) beat their GMP-implied listing price, while 29 (53.70%) underperformed. However, GMP correctly predicted the direction of listing in 77.78% of cases.
This suggests that GMP can be a useful directional indicator, but it is not consistently reliable for predicting the exact magnitude of listing gains.
2. Does high GMP mean an IPO will give strong listing gains?
Not necessarily. Among the 17 IPOs with GMP of 10% or more, 9 (52.94%) beat their GMP-implied prices, while 8 (47.06%) underperformed. However, GMP correctly predicted the direction of listing in all 17 cases (100% directional accuracy). Thus, high GMP was a strong directional signal in our sample, but it did not guarantee the magnitude of the listing gain.
3. Is there a correlation between GMP and IPO listing gains?
Yes. Based on our analysis of 54 IPOs with a GMP signal, the Pearson correlation between GMP (%) and actual listing gain/loss (%) was 0.9584, indicating a very strong positive correlation. This suggests that higher GMP was strongly associated with higher listing gains in our sample. However, this correlation does not mean that GMP alone determines listing gains, as other factors can also influence IPO listing performance.
4. Should investors apply for IPOs only based on GMP?
No. Our analysis shows that GMP can be a useful indicator, but it should not be used alone. Investors should also consider fundamentals, valuation, subscription, sector outlook, and market conditions before applying.
