
State Bank of India (SBI) reported a 10.23% YoY rise in standalone net profit to ₹21,121 crore in Q1FY27, while Net Interest Income (NII) increased 14.88% to ₹46,992 crore and operating profit grew 9.77% to ₹33,529 crore.
SBI shares reacted positively to the results on 7 August 2026. According to NSE data, the stock had a previous close of ₹1,085, opened at ₹1,080.10 and reached an intraday high of ₹1,124.50, or about 3.64% above the previous close. It eventually closed at ₹1,097.20, up about 1.12%.
The headline profit growth explains only part of the reaction. SBI combined strong credit and core earnings growth with improving asset quality. However, deposits grew considerably slower than advances, while margins remained broadly flat YoY.
So, what in SBI's Q1FY27 numbers supported the positive market reaction, and which numbers deserve closer attention?
SBI Q1FY27 Results at a Glance
| Particulars | Q1FY26 | Q4FY26 | Q1FY27 | YoY Change |
|---|---|---|---|---|
| Net Interest Income | ₹40,907 Cr | ₹44,380 Cr | ₹46,992 Cr | +14.88% |
| Operating Profit | ₹30,544 Cr | ₹27,704 Cr | ₹33,529 Cr | +9.77% |
| Net Profit | ₹19,160 Cr | ₹19,684 Cr | ₹21,121 Cr | +10.23% |
| Domestic NIM | 3.01% | 2.93% | 3.00% | -1 bp |
| Gross Advances | ₹42.55 lakh Cr | ₹49.33 lakh Cr | ₹50.47 lakh Cr | +18.63% |
| Deposits | ₹54.73 lakh Cr | ₹59.76 lakh Cr | ₹60.06 lakh Cr | +9.73% |
| CASA Ratio | 39.36% | 39.46% | 39.24% | -12 bps |
| GNPA | 1.83% | 1.49% | 1.47% | -36 bps |
| NNPA | 0.47% | 0.39% | 0.38% | -9 bps |
| Credit Cost | 0.47% | 0.27% | 0.27% | -20 bps |
The numbers show the basic picture clearly: strong earnings and credit growth, improving asset quality, but slower deposit growth and almost unchanged YoY margins.
Three numbers initially stand out:
NII grew faster than PAT: 14.88% versus 10.23%.
Advances grew almost twice as fast as deposits: 18.63% versus 9.73%.
Asset quality improved: GNPA declined 36 bps, NNPA fell 9 bps and credit cost declined 20 bps.
These numbers provide the starting point for understanding the quarter.
What Drove SBI's Profit Growth?
Interest income increased 8.54% YoY, while interest expenses grew at a slower 5.17%, helping NII increase 14.88%.
SBI also benefited from lower loan-loss provisions, which declined 31.92% from ₹4,934 crore to ₹3,359 crore.
However, the increase in PAT was not simply the result of lower loan-loss provisions. Operating profit itself grew 9.77% YoY to ₹33,529 crore, indicating improvement at the operating level as well.
That raises the next question: how did NII grow almost 15% when SBI's margins barely changed?
Credit Growth Was the Key Driver Behind NII Growth
SBI's gross advances increased 18.63% YoY from ₹42.55 lakh crore to ₹50.47 lakh crore.
Margins, meanwhile, provided little YoY support. Whole-bank NIM declined 3 bps from 2.89% to 2.86%, while domestic NIM was almost unchanged at 3.00% versus 3.01%.
A substantially larger lending base therefore helps explain SBI's strong NII growth despite broadly flat margins.
The growth was also spread across major domestic lending segments:
| Loan Segment | YoY Growth |
|---|---|
| Agriculture | 25.43% |
| SME | 22.33% |
| Corporate | 18.05% |
| Retail Personal | 15.15% |
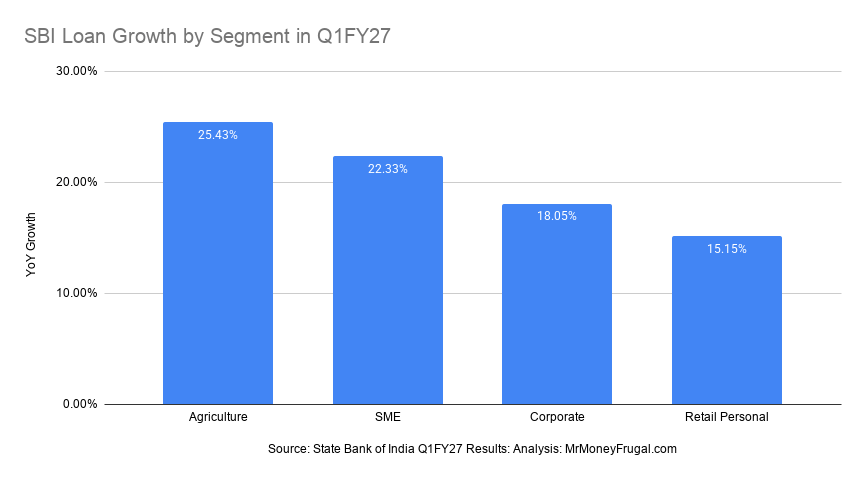
SBI's credit growth was broad-based in Q1FY27, with agriculture advances growing 25.43%, SME 22.33%, corporate 18.05% and retail personal advances 15.15% YoY.
Agriculture and SME lending recorded the fastest growth, while even SBI's much larger retail and corporate books expanded by more than 15%.
The credit-growth story was therefore strong. But it creates another question: are deposits growing fast enough to support it?
Are Deposits Keeping Pace With SBI's Loan Growth?
SBI's total deposits increased 9.73% YoY to ₹60.06 lakh crore, considerably slower than the 18.63% growth in advances.
CASA deposits increased 9.30%, while the CASA ratio slipped slightly from 39.36% to 39.24%. Retail term deposits, however, grew faster at 14.39% YoY.
The key divergence is:
Advances: +18.63%
Deposits: +9.73%
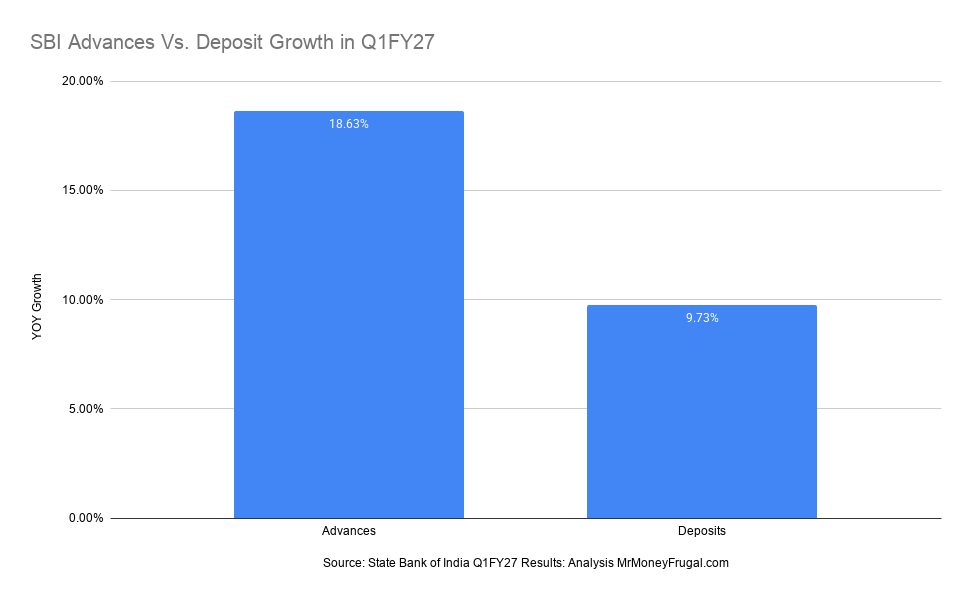
SBI's gross advances grew 18.63% YoY in Q1FY27, almost twice the 9.73% growth in deposits, contributing to a rise in the domestic credit-deposit ratio.
SBI's domestic credit-deposit ratio consequently increased from 68.88% in June 2025 to 74.23% in June 2026.
A rising CD ratio is not automatically negative—it also reflects greater deployment of deposits into loans. However, if advances continue growing significantly faster than deposits, deposit mobilisation becomes increasingly important for sustaining high credit growth without increasing funding pressure.
Rapid lending also raises another question: did SBI compromise on asset quality while expanding credit?
Asset Quality Improved Despite Rapid Credit Growth
The Q1FY27 numbers suggest otherwise.
SBI's Gross NPA ratio declined from 1.83% to 1.47%, while Net NPA improved from 0.47% to 0.38%. SBI states that its NPA ratios are now at their lowest levels in more than two decades.
Credit cost also declined from 0.47% to 0.27%, while the slippage ratio improved by 18 bps YoY to 0.57%.
This gives SBI an important combination:
18%+ credit growth + lower GNPA + lower NNPA + lower credit cost + lower slippage ratio
In other words, SBI expanded its loan book rapidly without a corresponding deterioration in its headline asset-quality indicators during the quarter.
That is one of the strongest parts of the Q1FY27 result.
SBI Funds Management After Its IPO
SBI's Q1FY27 results also provide an interesting update on SBI Funds Management, which completed its IPO in July 2026.
SBI Funds Management reported ₹873 crore PAT in Q1FY27, compared with ₹845 crore in Q1FY26. Its quarterly average mutual fund AUM increased from ₹11.40 lakh crore to ₹12.61 lakh crore, giving the AMC a 15.12% market share.
SBI also reported that following the divestment of a 6.3007% stake through the IPO in July 2026, its holding in SBI Funds Management stands at 55.56%.
Related Analysis: SBI Funds Management IPO Review
This subsidiary performance is not the primary driver of SBI's Q1FY27 banking performance, but it provides useful context on the scale and performance of one of SBI's important financial-services businesses.
What Did the Market Like — and What Should Investors Watch?
SBI's Q1FY27 numbers contain more positives than negatives, although the quarter was not uniformly strong.
| Factor | Q1FY27 Observation | Assessment |
|---|---|---|
| Core earnings | NII +14.88%; Operating Profit +9.77% | Positive |
| Credit growth | Gross Advances +18.63% | Strong Positive |
| Credit diversification | Major segments grew 15%+ | Positive |
| Asset quality | GNPA 1.47%; NNPA 0.38% | Strong Positive |
| Credit cost | 0.47% → 0.27% | Positive |
| Slippage ratio | Improved to 0.57% | Positive |
| Margins | Domestic NIM 3.01% → 3.00% | Neutral/Mixed |
| Deposit growth | +9.73% vs Advances +18.63% | Watch |
| Domestic CD ratio | 68.88% → 74.23% | Watch |
| CASA ratio | 39.36% → 39.24% | Neutral/Mixed |
The strongest combination was rapid credit growth alongside improving asset quality. Credit expansion translated into higher NII and operating profit even without wider margins.
The principal issue to monitor is funding: advances grew almost twice as fast as deposits, pushing the CD ratio higher.
Why Did SBI Shares Rise After Q1FY27 Results?
SBI's Q1FY27 numbers provide a logical basis for the positive market reaction.
The bank delivered 10.23% PAT growth, 14.88% NII growth and 18.63% growth in gross advances, while operating profit increased 9.77%. At the same time, GNPA, NNPA, credit cost and the slippage ratio all improved.
The combination is important because SBI achieved rapid credit growth without deterioration in headline asset quality.
The results were not flawless. Deposit growth lagged credit growth considerably, the domestic CD ratio increased and margins remained broadly flat YoY.
That balance was also visible in SBI's share-price movement on 7 August 2026. The stock traded as high as ₹1,124.50, 3.64% above its previous close of ₹1,085, before closing at ₹1,097.20, a gain of about 1.12%.
Overall, SBI's Q1FY27 performance can be summarised as:
Strong credit and core earnings growth + improving asset quality, balanced against slower deposit growth and limited margin expansion.
The underlying numbers therefore provide a more complete explanation of SBI's positive market reaction than the 10.23% PAT-growth headline alone.
Explore More Investment Research
- SBI Funds Management IPO Review
- Why Did SBI Funds Management IPO List at Just a 6.85% Premium Despite 34.16x Subscription?
- IPO Market Analytics
- IPO Calendar India
- GMP Today
- Day-wise IPO Subscription Status
- IPO Allotment Status
- Mutual Fund Learning Hub
Disclaimer: This analysis is for educational and informational purposes only and should not be considered investment advice. Investors should conduct their own research and consult a SEBI-registered investment adviser where appropriate.
