
SBI Funds Management Limited made a positive debut on the BSE and NSE, listing at ₹613.30 against its issue price of ₹574, delivering a 6.85% listing gain to IPO investors.
The relatively modest listing gain stood in contrast to strong investor demand. The IPO was subscribed 34.16x overall, with the QIB portion receiving an exceptional 114.96x subscription, while NII and Retail portions were subscribed 20.33x and 2.30x, respectively.
Grey market expectations had also been considerably stronger. GMP climbed as high as ₹141 during the IPO period before declining to ₹65 ahead of listing. The final GMP implied a potential premium of around 11.32%, compared with the actual listing gain of 6.85%.
So, despite 34.16x overall subscription and 114.96x QIB demand, SBI Funds Management eventually listed at only a 6.85% premium, below the 11.32% premium implied by the final GMP. What explains this divergence?
Before diving into the analysis, you can also read our SBI Funds Management IPO Review for a detailed assessment of the company's financials, valuation, strengths, risks and IPO details.
Listing Snapshot — SBI Funds Management
| Particular | Details |
|---|---|
| Issue Price | ₹574 |
| Listing Price | ₹613.30 |
| Listing Gain | 6.85% |
| Last GMP | ₹65 |
| GMP-implied Premium | 11.32% |
| Listed Above GMP Expectations | No |
| Overall Subscription | 34.16x |
| QIB Subscription | 114.96x |
| NII Subscription | 20.33x |
| RII Subscription | 2.30x |
Looking for other public issues? Visit our Latest IPOs page to track upcoming, ongoing and recently listed IPOs.
Subscription Surged on the Final Day, but GMP Cooled Before Listing
Investor demand for SBI Funds Management accelerated sharply towards the end of the IPO. Subscription increased from just 0.44x on Day 1 to 1.90x on Day 2, before surging to 34.16x on the final day.
The demand was heavily skewed towards institutional investors. QIB subscription reached 114.96x, compared with 20.33x for NIIs and 2.30x for Retail Investors, indicating substantially stronger institutional participation.
Grey market sentiment, however, followed a different trajectory. GMP climbed from ₹0 to a peak of ₹141, but subsequently became volatile and declined to ₹65 ahead of listing. At the ₹574 issue price, the final GMP implied a potential premium of around 11.32%.
The contrasting signals are notable: institutional demand surged dramatically on the final day, while GMP had already fallen substantially from its ₹141 peak. The eventual ₹613.30 listing delivered a 6.85% gain, confirming that the strong subscription—particularly from QIBs—did not translate proportionately into listing-day returns.
For the latest grey market updates across active IPOs, visit our IPO GMP Today page. You can also track QIB, NII and retail demand through our Day-wise IPO Subscription Status page.
Strong Earnings Growth and a Debt-Free Balance Sheet
SBI Funds Management entered the IPO with consistent financial growth. Total Income increased from ₹3,426.08 crore in FY24 to ₹4,976.11 crore in FY26, representing growth of about 45% in two years.
Profitability expanded at a similar pace. PAT increased from ₹2,072.79 crore in FY24 to ₹3,067.38 crore in FY26, a rise of approximately 48%, while EBITDA increased from ₹2,718.82 crore to ₹4,058.44 crore, growing about 49% over the same period.
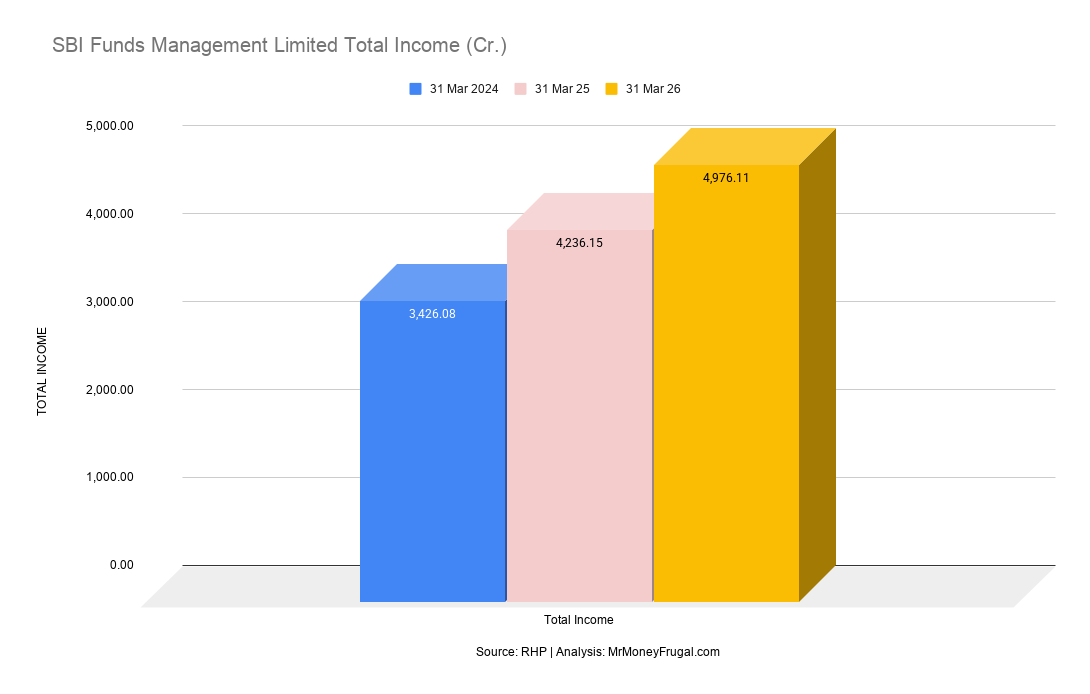
Total Income Grew Around 45% from FY24 to FY26

PAT Increased Around 48% in Two Years
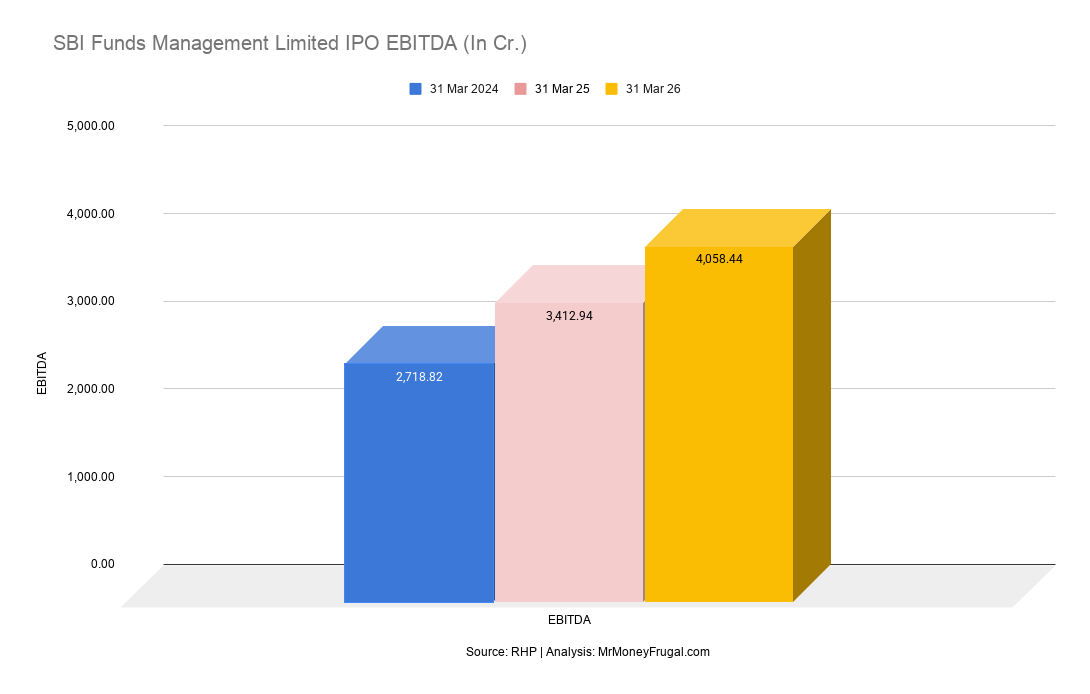
EBITDA Grew Around 49% Alongside Earnings Expansion
The company also operated with zero borrowings across FY24, FY25 and FY26, while its IPO review reported an EBITDA margin of over 92% in FY26, highlighting the capital-light and highly cash-generative nature of the business.
Overall, SBI Funds entered the market with consistent revenue and earnings growth, high operating margins and no debt, providing a strong fundamental backdrop despite the eventual listing gain being limited to 6.85%.
Relative Valuation and High RoNW Supported the Investment Case
SBI Funds Management entered the market at an implied P/E of 38.06x at the upper price band of ₹574, below the peer-group average of 41.64x reported in the IPO review.
Its valuation was lower than ICICI Prudential AMC at 49.38x, HDFC AMC at 41.71x and Nippon Life India AMC at 51.10x, although higher than Aditya Birla Sun Life AMC at 34.46x and UTI AMC at 31.57x.
The company also reported a strong RoNW of 43.02%, second only to ICICI Prudential AMC at 85.80% among the peers considered in the review.
Therefore, SBI Funds combined a moderated relative valuation with high capital efficiency and strong earnings growth. These factors likely strengthened the investment case, although the 38.06x P/E did not represent a discount to every listed peer.
100% OFS Meant No Fresh Capital for the Company
SBI Funds Management's ₹11,692.91 crore IPO was entirely an Offer for Sale (OFS), with promoters State Bank of India and Amundi India Holding selling 20,37,09,239 shares.
As a result, SBI Funds itself received no fresh capital from the IPO. The offering primarily provided a partial exit route for existing shareholders while bringing the company onto the public markets.
However, the absence of fresh capital was less critical from a balance-sheet perspective because SBI Funds reported zero borrowings across FY24, FY25 and FY26 and operated a highly cash-generative business.
Therefore, the 100% OFS structure was a limitation from a fresh-growth-capital perspective, but unlike a leveraged company, SBI Funds did not require IPO proceeds for debt reduction or balance-sheet repair.
If you're unfamiliar with terms such as Fresh Issue, OFS, GMP, QIB, NII or RII, our IPO Glossary explains 100+ commonly used IPO terms.
Strong Market Position, but Structural Risks Remained
SBI Funds Management benefited from the distribution strength of over 23,000 SBI branches and the YONO platform, while its 16.21 million live SIP accounts represented a 15.5% market share.
It also led the industry in B-30 markets with 19.2% of sector B-30 Monthly Average Assets Under Management (MAAUM).
However, risks remained. The new SEBI Base Expense Ratio framework could pressure management-fee yields, while revenues remained exposed to market-linked AUM movements. The company's top five schemes also accounted for 42.57% of its Quarterly Average Assets Under Management (QAAUM).
Overall, SBI Funds combined strong distribution, a large SIP franchise and deep retail penetration with regulatory and market-linked risks—supporting the business case without eliminating concerns around future revenue and margin growth.
Why Did SBI Funds Management IPO List at Just a 6.85% Premium Despite 34.16x Subscription?
| Factor | Key Observation | Likely Impact |
| Financial Growth | PAT +48%, EBITDA +49% from FY24–FY26 | Strong Positive |
| Balance Sheet | Zero borrowings across FY24–FY26 | Positive |
| Valuation | P/E 38.06x vs peer average of 41.64x | Positive |
| Profitability | RoNW of 43.02% | Strong Positive |
| Investor Demand | 34.16x overall; QIB 114.96x | Strong Positive |
| Market Sentiment | GMP peaked at ₹141 but fell to ₹65 | Mixed |
| IPO Structure | 100% OFS; no fresh capital for the company | Mixed |
| Key Risks | Fee compression, market-linked AUM and scheme concentration | Negative |
SBI Funds Management entered the market with several supportive factors: PAT grew 48%, EBITDA rose 49%, the company remained debt-free, RoNW stood at 43.02%, and the IPO was priced at 38.06x P/E—below the 41.64x peer average.
These fundamentals were accompanied by exceptional 114.96x QIB subscription.
However, the headline 34.16x subscription masked a significant difference between investor categories, with Retail demand at only 2.30x compared with 114.96x for QIBs.
The IPO was also entirely an OFS, while GMP had already declined sharply from its ₹141 peak to ₹65 before listing.
The eventual ₹613.30 listing delivered a 6.85% gain, below the 11.32% premium implied by the final GMP.
The outcome suggests that strong institutional demand and solid fundamentals supported a positive debut, but they did not translate proportionately into listing-day returns.
Key Takeaways
- Issue Price: ₹574
- Listing Price: ₹613.30
- Listing Gain: 6.85%
- Final GMP: ₹65, implying around 11.32% premium
- Overall Subscription: 34.16x
- QIB Subscription: 114.96x
- Positive Factors: Strong earnings growth, zero debt, 43.02% RoNW and relatively moderated valuation.
- Why the Gain Was More Modest: Retail demand was only 2.30x, GMP had cooled sharply from its ₹141 peak, and the IPO was entirely an OFS.
- Key Risks: Regulatory fee compression, market-linked AUM exposure and concentration in the top five schemes.
Related IPO Resources
- SBI Funds Management IPO Review
- IPO GMP Today
- Day-wise IPO Subscription Status
- IPO Allotment Status
- Latest IPOs
- IPO Glossary
- IPO Market Analytics & Research
- Why Did Manipal Health IPO List at a 10.51% Premium Despite Weak Subscription?
- Why Did Poojaa Precision Engineering IPO List at a 56.15% Premium?
- Indo-MIM IPO Listed at 44.33% Premium: Here's Why
Explore more IPO Listing Analysis articles on our IPO Market Analytics & Research page.
Disclaimer
This analysis is for informational and discussion purposes only and should not be considered investment advice or a recommendation to buy, sell or hold any security. IPO and listing performance can be affected by multiple market factors, and the relationships discussed above do not establish causation. Investors should conduct their own research and consult a SEBI-registered investment adviser where appropriate.
