
Gaja Alternative Asset Management Limited operates as a premier alternative asset manager in India, specializing in private equity strategies that focus on mid-market growth investments across sectors such as education, financial services, and consumer staples.
Transitioning to the public markets, the Gaja Alternative IPO opens for public subscription on August 19, 2026, and is scheduled to close on August 21, 2026.
The firm aims to raise up to ₹550.00 crores through a combination of a fresh issue of ₹450.00 crores and an offer for sale of ₹100.00 crores by existing promoters and investors.
The company has fixed its pricing parameters between ₹152 and ₹160 per share, requiring retail participants to bid for at least 93 equity shares.
Find all the key details for the Gaja Alternative IPO here, including current GMP, live subscription status, important allotment timelines, price bands, and a complete analysis.
Briefs of Gaja Alternative IPO Details
- Price Band: ₹152 – ₹160 per share
- IPO Open / Close Dates: 19 August 2026 / 21 August 2026
- Lot Size: 93 shares (Minimum retail investment: ₹14,880)
- Issue Size: Up to ₹550.00 crores
- Fresh Issue / OFS: Fresh Issue of ₹450.00 crores / OFS of ₹100.00 crores
- Registrar: MUFG Intime India Private Limited
- Listing Exchange: BSE, NSE
IPO Reservation
- Face value: ₹5 per share
- Anchor offer: Up to 60% of the QIB Portion
- QIB-shares: Not more than 50% of the total Offer
- NIIs-Shares offered: Not less than 15% of the total Offer
- RIIs- Shares offered: Not less than 35% of the total Offer
What is Today's GMP for the Gaja Alternative IPO?
Our updated GMP hub page provides real-time tracking for this and matching public issues. Interested investors who want to track more GMP behaviours can check IPO GMP vs Listing Accuracy Study 2026.
Investors should remember that GMP is driven by informal market demand, changes daily, and is completely unregulated by official bodies like SEBI, NSE, or BSE.
When are the Key Gaja Alternative IPO Dates and Allotment Scheduled?
- IPO Open & Close Date: 19 August 2026 to 21 August 2026
- Basis of Allotment Date: 24 August 2026
- Refund Initiation Date: 25 August 2026
- Credit of Shares: 25 August 2026
- Listing Date: 26 August 2026
What are the Proposed Objectives of the Gaja Alternative IPO?
The company's leadership plans to utilize the net capital raised from the new share issuance for the following primary purposes:
- Sponsor Commitments & Debt Repayment: A major portion of the funds will be directed to meet the firm's mandatory Sponsor Commitments (General Partner contribution) for its existing Fund IV and the proposed Fund V, alongside repaying a ₹19.50 crore bridge loan tied to these commitments.
- Secondaries Fund: Capital will be allocated to fund the sponsor commitment for the newly established, sector-agnostic Secondaries Fund.
- General Corporate Purposes: Up to 25% of the gross offering proceeds will be used to cover routine business overheads, marketing campaigns, and expenses related to institutional fundraising. (Note: The company will receive no financial proceeds from the ₹100.00 crore Offer for Sale portion of the issue..
What do the Financial Results of Gaja Alternative Indicate?
The following section presents a condensed view of the firm's historical financial statements, denominated in ₹ crores.
Period Ended | 31 Mar 26 | 31 Mar 2025 | 31 Mar 24 |
Total Income | 157.80 | 123.31 | 103.96 |
Profit After Tax | 81.96 | 61.95 | 44.74 |
EBITDA | 72.05 | 60.81 | 49.25 |
Total Borrowing | 41.56 | 4.00 | 3.51 |
Assets | 706.49 | 451.87 | 388.60 |
Source: RHP
Financial Observations
Total Income
The company registered a highly robust upward trajectory in its revenue streams over the observed fiscal periods.
- Total income scaled impressively from ₹103.96 crores in FY24 to ₹157.80 crores in FY26.
- This surge was fueled by a lucrative mix of predictable quarterly Management Fees and performance-linked Carried Interest.
- Carried Interest surged by 310% over the two years, reflecting successful underlying exit events within its managed funds.
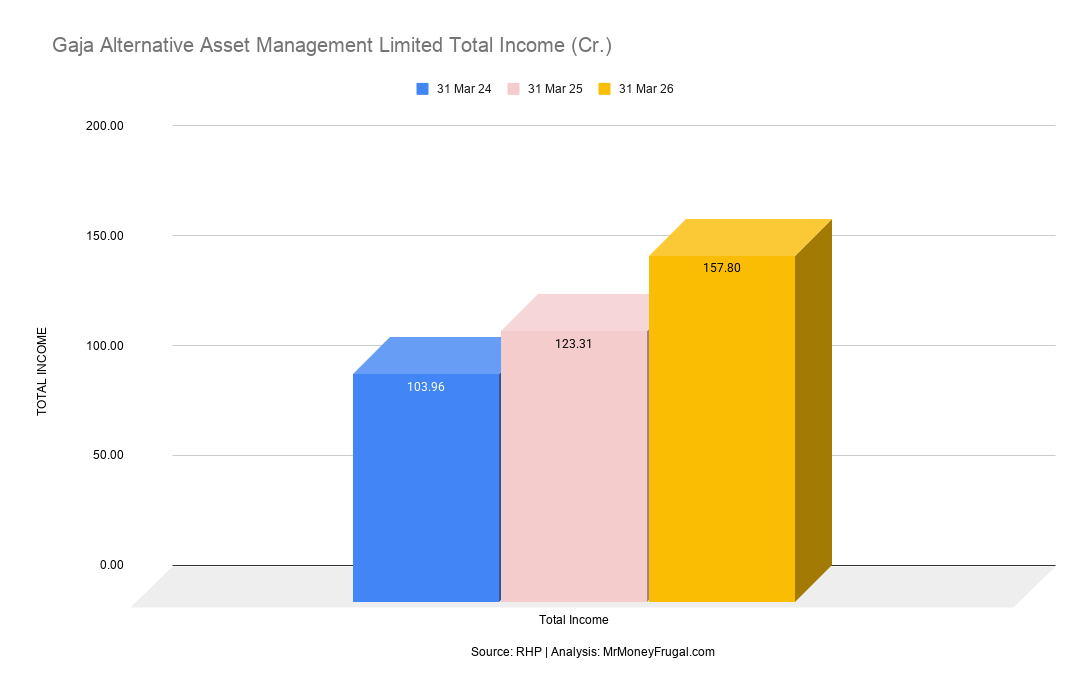
Total income rose consistently from 103.96 in FY2024 to 157.80 in FY2026, an increase of about 51.8% over the two-year period.
Profit After Tax
Net profitability experienced substantial sequential growth, demonstrating the operating leverage inherent to alternative asset management.
- PAT surged dramatically from ₹44.74 crores in FY24 to ₹81.96 crores in FY26.
- The PAT margin expanded from 43.04% in FY24 to 51.94% in FY26.
- As the fund size grows, the asset-light structure allows a larger proportion of incremental fees to flow directly to the bottom line.
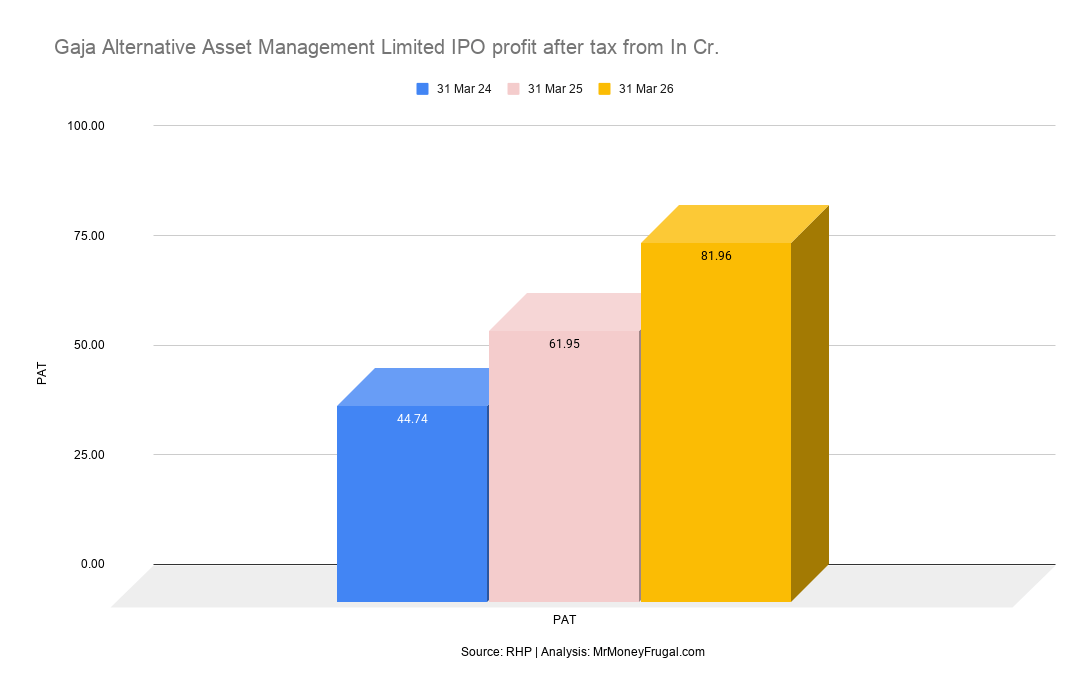
Profit after tax increased steadily from 44.74 in FY2024 to 81.96 in FY2026, representing an increase of about 83.1%.
EBITDA
Core operational earnings advanced significantly, reflecting the firm's strict control over fixed and administrative overheads.
- EBITDA increased steadily from ₹49.25 crores in FY24 to ₹72.05 crores in FY26.
- The high operational margins are supported by a personnel-driven cost structure rather than heavy fixed-capital investments.
- The firm successfully shielded its operational earnings from massive scaling costs.
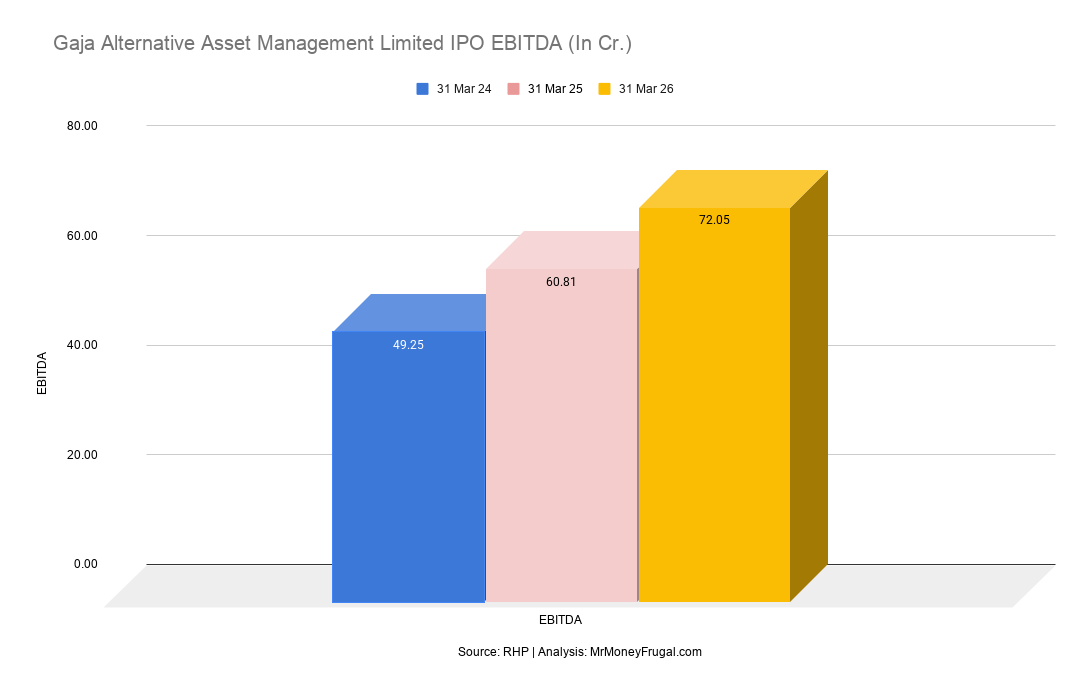
EBITDA grew consistently from 49.25 in FY2024 to 72.05 in FY2026, an increase of about 46.3%.
Total Borrowing
The business strategically utilised short-term external debt to manage the timing of its mandatory Sponsor Commitments.
- Total borrowings rose from ₹3.51 crores in FY24 to ₹41.56 crores in FY26.
- These funds were largely drawn through secured bank overdrafts and short-term term loans to support Fund IV commitments.
- Despite this increase, the firm maintains a highly conservative debt-to-equity ratio of just 0.07x in FY26.
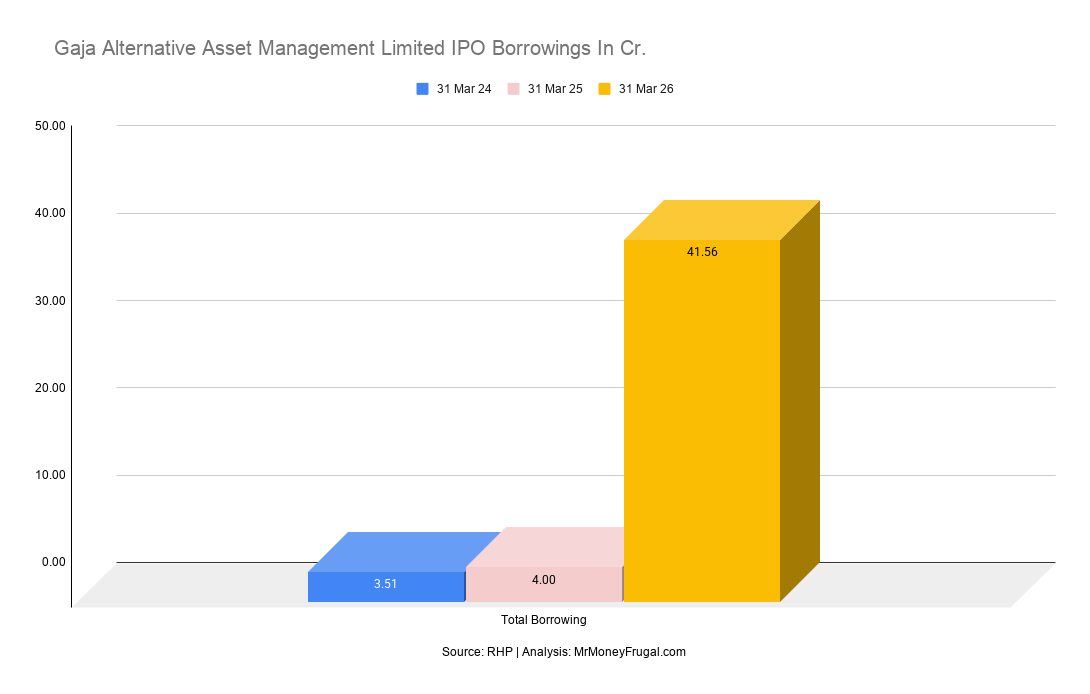
Total borrowing remained low in FY2024 and FY2025 before rising sharply to 41.56 in FY2026.
Assets
The overall resource base of the company expanded to reflect its growing 'skin-in-the-game' across its managed funds.
- Total assets grew significantly from ₹388.60 crores in FY24 to ₹706.49 crores in FY26.
- This asset base is heavily dominated by long-term, unquoted financial investments representing Sponsor Commitments.
- The firm also maintains a strong liquidity buffer, holding ₹71.07 crores in cash and cash equivalents.
What Are the P/E ratio and Peer Comparison of Gaja Alternative Asset Management Limited?
Based on the top end of the price band at ₹160 and an FY26 EPS of ₹7.17, Gaja Alternative's price-to-earnings (P/E) multiple stands at 22.31x.
|
Analysis:
Gaja Alternative enters the primary market demanding an implied P/E multiple of approximately 22.31x at the upper price band.
When evaluated against listed industry peers, the issue appears to be priced at a massive discount to both premium wealth managers like Anand Rathi Wealth (91.50x) and 360 One WAM (40.01x), as well as traditional mutual fund houses like Nippon Life India (49.57x) and Aditya Birla Sun Life AMC (30.28x).
While operating on a much smaller absolute revenue base (₹135.53 crores in FY26) compared to these listed giants, Gaja’s highly specialised focus on alternative private equity yields strong operational leverage and a massive 51.94% PAT margin.
With an implied valuation significantly below the industry average P/E of 43.52x, the offering presents a highly attractive entry multiple for investors seeking pure-play exposure to India's unlisted alternative investment boom.
What is The Industry Outlook of Gaja Alternative Asset Management Limited?
Growth potential
- The Assets Under Management (AUM) for Indian alternative investments are projected to grow at a massive 25-27% CAGR between 2026 and 2030, presenting immense scalability for mid-market private equity strategies.
- Increasing domestic wealth creation and the expansion of the High Net-Worth Individual (HNI) demographic are driving a structural shift from traditional mutual funds toward high-yield alternative assets.
- The maturing Indian start-up and mid-cap ecosystem provides an expansive pipeline for private equity fund deployment, value creation, and eventual high-yield exits.
Market trends
- Alternative AMCs operate with high operational leverage, as revenues from Carried Interest scale non-linearly with successful exit events, providing outsized profit kicker opportunities.
- Regulatory frameworks are increasingly encouraging institutional participation, driving large-scale capital commitments from global pension funds and sovereign wealth funds into top-tier Indian general partners (GPs).
- The secondary fund market is emerging as a critical trend, allowing specialised funds to purchase assets from other general partners, thereby providing liquidity and faster turnaround yields for limited partners (LPs).
What Are The Strengths and Potential Risks of Gaja Alternative IPO?
Strengths:
- High-Margin Model: The company captures the full economic chain of private equity, enjoying a stellar PAT margin of 51.94% in FY26, driven by lucrative performance-linked Carried Interest.
- Valuation Arbitrage: At the upper price band, the implied P/E of 22.31x offers a steep valuation discount compared to the listed peer average of 43.52x.
- Asset-Light Scalability: The business structure is personnel-driven rather than capital-intensive, allowing the firm to maintain a highly conservative debt-to-equity ratio of just 0.07x in FY26.
Risks:
- Lumpy Cash Flows: Carried Interest represents 47.79% of Total Income (FY26). Because this is contingent on exits, a dry spell in IPOs or secondary markets can severely contract quarterly cash flows.
- Negative Cash Flows: Working capital movements caused negative operating cash flows of ₹(14.98) crores in FY26 and ₹(8.75) crores in FY25.
- Concentration Risks: The top 10 Limited Partners (LPs) contribute 63.42% of total fund commitments, exposing fund-raising to significant client concentration risk.
Key Considerations for Investors
- Valuation Discount: At the upper band, the company demands an implied P/E of ~22.31x, offering a steep valuation discount compared to premium wealth managers (Anand Rathi at 91.50x) and traditional AMCs.
- Lumpy Revenue Profile: Carried Interest, which relies on successful exits, constitutes 47.79% of total income, making future cash flows highly susceptible to broader capital market volatility.
- Cash Flow Strain: Despite massive profit growth, the firm reported negative operating cash flows of ₹(14.98) crores in FY26 due to working capital shifts.
- Strong Return Metrics: The firm operates with incredible capital efficiency, yielding an EBITDA of ₹72.05 crores and a massive 51.94% PAT margin in FY26.
Important IPO Related Resources
1. Upcoming & Live IPOs in India
2. IPO Allotment Status – How to Check Allotment Status of IPO Shares
3. IPO Subscription Status Today
5. July 2026 IPO Subscription Review: 32 IPOs Data, Demand Patterns & Key Trends
6. July 2026 IPO Review: 33 IPOs, ₹21140.52 Cr Raised & 56.37x Average Subscription
Key Takeaways
- IPO Price Band: ₹152 to ₹160 per equity share
- Lot Size: 93 shares (Minimum retail application of ₹14,880)
- Allotment Date: Allotment on 24 August 2026
- Listing Dates: Listing on BSE and NSE on 26 August 2026
FAQs on Gaja Alternative IPO
You can track real-time GMP shifts for this mainboard issue on our central hub, where these unofficial premium rates are updated daily to reflect shifting market demand.
The issue price has been established at ₹152 to ₹160 per share.
The official basis of allotment is slated for completion on 24 August 2026.
To confirm your allotment status once the process concludes, log onto the platform of the registrar, MUFG Intime India Private Limited, or check the BSE and NSE portals by entering your application details or PAN.
The company proposes to list its equity shares on the mainboard platforms of BSE and NSE on 26 August 2026.
Gaja Alternative Asset Management Limited presents a highly profitable, asset-light private equity business model boasting an impressive 35.34% PAT CAGR.
The company is strategically positioned to leverage India’s projected 25-27% alternative AUM growth through 2030.
However, investors must carefully weigh these expansion tailwinds against severe client concentration, where the top ten partners contribute 63.42% of total commitments, highly volatile performance fees, and persistent negative operating cash flows in recent years.
Disclaimer: The details provided herein are intended for informational and educational purposes only, not as official investment recommendations. Individuals must verify their financial strategies with a certified SEBI professional prior to allocating capital.
