
LEAP India Limited made a positive debut on the NSE, listing at ₹165.90 against its issue price of ₹159, delivering a 4.34% listing gain.
What makes the listing interesting is that the final grey-market premium had indicated a considerably higher price. LEAP India's final ₹13 GMP implied a listing price of ₹172, or a potential premium of 8.18% over the ₹159 issue price. Instead, the stock opened at ₹165.90.
The IPO was subscribed 6.71x overall, but the demand pattern was uneven.
Subscription stood at only 0.06x on Day 1 and 0.23x on Day 2 before jumping to 6.71x on the final day.
The QIB and NII portions were subscribed 12.83x and 11.39x, respectively, while the retail portion received 1.20x subscription.
The IPO also carried a demanding 104.61x P/E, despite strong financial growth.
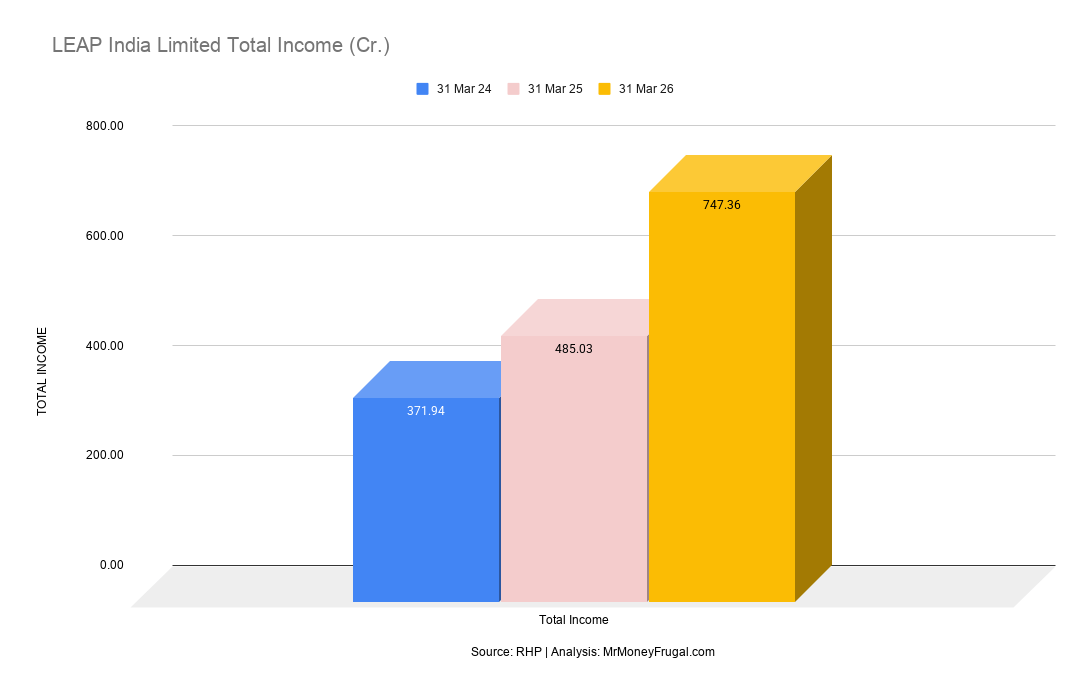
Total Income increased from ₹371.94 crore in FY24 to ₹747.36 crore in FY26, while PAT rose to ₹62.34 crore.
This creates an interesting divergence: LEAP India had strong financial growth, positive GMP and substantial QIB/NII demand, yet its actual listing gain was only 4.34%. What explains the relatively modest debut?
Before diving into the listing analysis, you can read our LEAP India IPO Review for a detailed assessment of the company's financials, valuation, strengths, risks and IPO details.
Listing Snapshot — LEAP India
Particular | Details |
Issue Price | ₹159 |
NSE Listing Price | ₹165.90 |
Listing Gain | 4.34% |
Last GMP | ₹13 |
GMP-Implied Premium | 8.18% |
Listed Above GMP Expectations | No |
Overall Subscription | 6.71x |
QIB Subscription | 12.83x |
NII Subscription | 11.39x |
Retail Subscription | 1.20x |
Employee Subscription | 8.96x |
P/E | 104.61x |
Issue Size | ₹2,480 Cr |
Listing Platform | NSE |
For other public issues, visit our Latest IPOs page.
Weak Early Subscription Contrasted With Volatile GMP
Investor demand for LEAP India remained subdued during the first two days of the issue. The IPO was subscribed just 0.06x on Day 1 and 0.23x on Day 2, before eventually closing at 6.71x overall.
The participation was also uneven. The QIB portion was subscribed 12.83x and the NII portion 11.39x, while the Retail portion received only 1.20x subscription.
Employee participation stood at 8.96x.
Grey market sentiment followed a different path. LEAP India's GMP moved from ₹8 → ₹4 → ₹3 → ₹8 → ₹15 → ₹19 → ₹17 → ₹14 → ₹15 → ₹16 → ₹10 → ₹12 → ₹13 → ₹9 → ₹13 → ₹12 → ₹11 → ₹12 → ₹14 → ₹12 → ₹13 during the tracking period.
The GMP therefore fell to a low of ₹3, subsequently reached a high of ₹19, and ended at ₹13 ahead of listing.
At the ₹159 issue price, the final ₹13 GMP implied a potential listing price of ₹172, representing an 8.18% premium. LEAP India instead listed at ₹165.90, delivering a 4.34% gain.
The actual listing was therefore ₹6.10 below the final GMP-implied price, showing that the grey market expectation was more optimistic than the eventual NSE price discovery.
For the latest grey market updates, track our IPO GMP Today page. You can also follow investor-category demand through our Day-wise IPO Subscription Status page.
Revenue Doubled, While Profit Growth Accelerated in FY26
LEAP India entered the IPO with strong financial momentum. Total Income increased from ₹371.94 crore in FY24 to ₹485.03 crore in FY25 and ₹747.36 crore in FY26, effectively doubling over two years.
Profitability also improved.
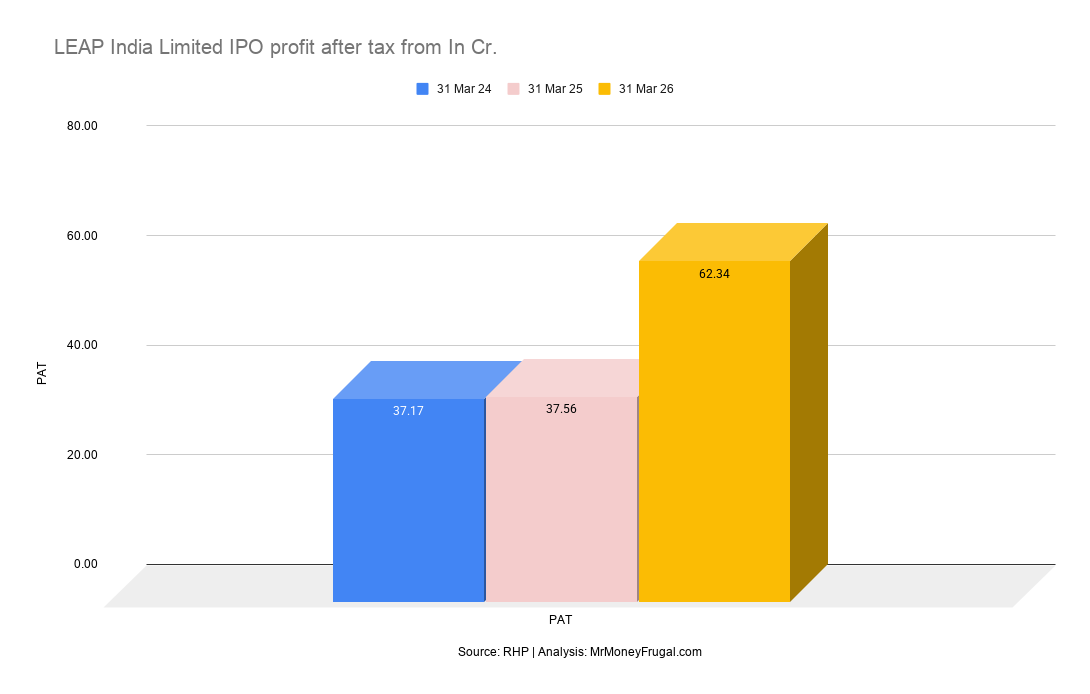
PAT increased from ₹37.17 crore in FY24 to ₹37.56 crore in FY25 and ₹62.34 crore in FY26, with FY26 profit growth of approximately 66% over FY25.
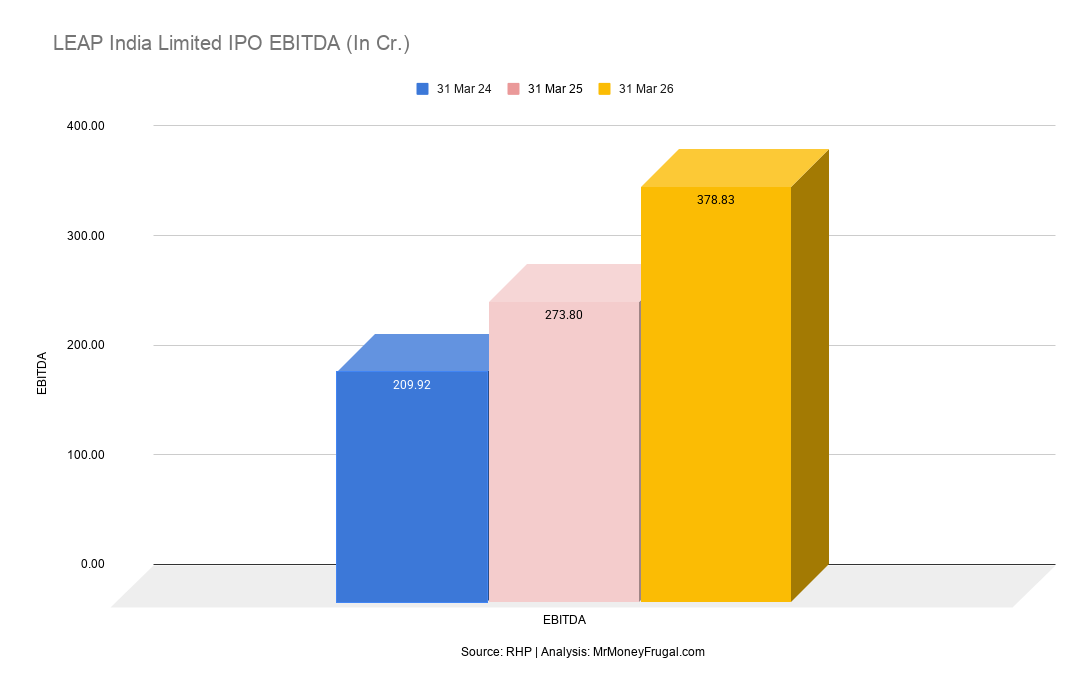
EBITDA increased from ₹209.92 crore in FY24 to ₹378.83 crore in FY26, while the company reported an EBITDA margin of around 50.69% in FY26.
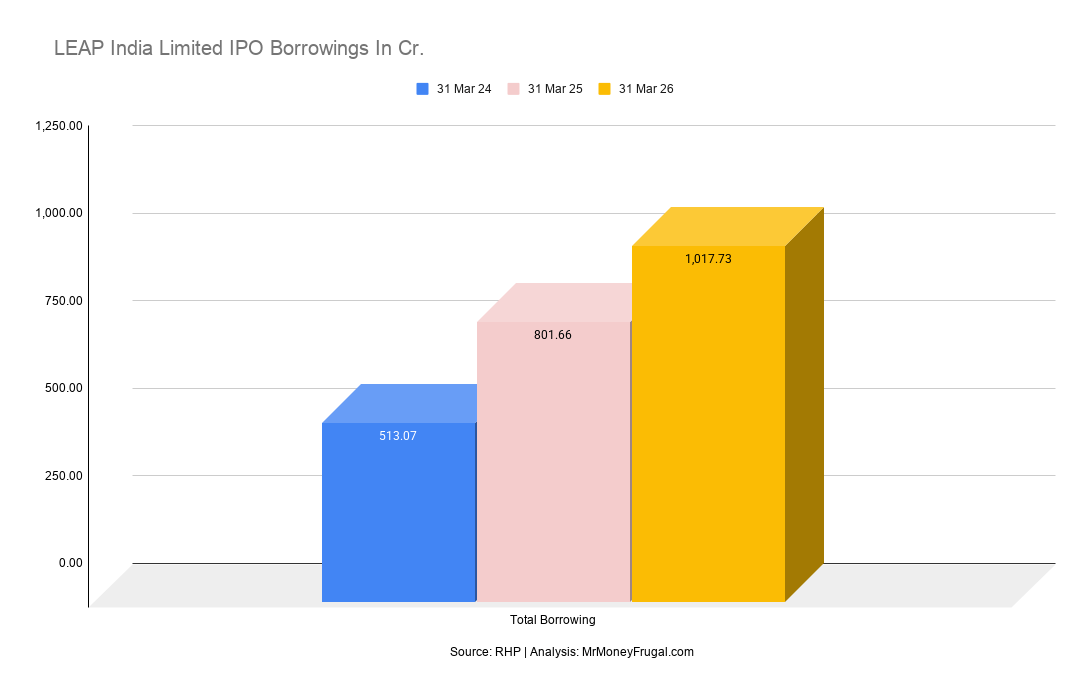
However, the expansion was accompanied by rising borrowings. Total borrowing increased from ₹513.07 crore in FY24 to ₹801.66 crore in FY25 and ₹1,017.73 crore in FY26.
The IPO's ₹480 crore Fresh Issue included approximately ₹360 crore for debt repayment, making deleveraging an important use of the proceeds.
Total assets also increased from ₹1,400.28 crore in FY24 to ₹2,401.05 crore in FY26, reflecting the capital-intensive nature of LEAP India's asset-pooling business.
Therefore, LEAP India entered the IPO with strong revenue growth, improving profitability and a high EBITDA margin, although this growth was accompanied by a substantial increase in borrowings.
High P/E of 104.61x, With No Direct Listed Peer
LEAP India entered the IPO at an implied P/E of 104.61x, calculated using the ₹159 upper price band and FY26 EPS of ₹1.52.
The valuation is particularly important because the company's RHP does not identify a directly comparable listed company in India or globally with the same business model and operational characteristics.
This makes conventional peer-based P/E comparison difficult.
LEAP India operates in the specialised pallet and supply-chain asset-pooling segment, where scale, asset network and customer relationships are important competitive factors.
The company has built a large asset base and reported strong operating margins, but the capital-intensive model also requires significant funding.
The IPO structure partly addressed this issue through the Fresh Issue. Of the ₹2,480 crore total issue size, ₹480 crore was a Fresh Issue and ₹2,000 crore was an OFS, with approximately ₹360 crore from the fresh proceeds earmarked for debt repayment.
The combination therefore presented investors with two contrasting features: strong financial growth and operating profitability on one side, and a 104.61x P/E together with more than ₹1,000 crore of borrowings on the other.
LEAP India vs Other Mainboard IPOs Listed This Week
LEAP India was one of three mainboard IPOs that listed this week. The difference in their subscription levels, valuations and listing gains is notable.
IPO | P/E | Subscription | NSE Listing Gain |
15.96x | 109.61x | 35.85% | |
14.73x | 29.95x | 33.96% | |
104.61x | 6.71x | 4.34% |
Ardee Industries and Technocraft Ventures were offered at P/E multiples of 15.96x and 14.73x, respectively, compared with LEAP India's 104.61x.
They also received substantially higher subscription and subsequently delivered listing gains of 35.85% and 33.96%, respectively.
The comparison is based on only three mainboard IPOs and therefore does not establish a general relationship between valuation, subscription and listing performance. However, the contrast is notable.
LEAP India had the highest P/E and lowest subscription among these three IPOs, and it also recorded the lowest listing gain.
For broader listing-performance data, our IPO Market Analytics section tracks IPO performance across listings.
Key Takeaways
Issue Price: ₹159
NSE Listing Price: ₹165.90
Listing Gain: 4.34%
Final GMP: ₹13, implying an 8.18% premium
GMP vs Actual Listing: Actual listing was ₹6.10 below the final GMP-implied price
Overall Subscription: 6.71x
QIB Subscription: 12.83x
NII Subscription: 11.39x
Retail Subscription: 1.20x
P/E: 104.61x
Financial Growth: Total Income increased from ₹371.94 crore in FY24 to ₹747.36 crore in FY26
FY26 PAT: ₹62.34 crore
FY26 EBITDA: ₹378.83 crore
FY26 Borrowings: ₹1,017.73 crore
Issue Structure: ₹480 crore Fresh Issue + ₹2,000 crore OFS
Overall Observation: Strong financial growth and institutional demand supported the IPO, but the high valuation and moderate overall subscription were accompanied by a relatively modest 4.34% listing gain.
Related Topics
1. Why Did SBI Shares Rise After Q1FY27 Results? Profit, NII & Asset Quality Explained
2. Why Did Teja Engineering IPO List at a 90% Premium Despite Just 1.06x Subscription?
3. Why Did SBI Funds Management IPO List at Just a 6.85% Premium Despite 34.16x Subscription?
4. Why Did Poojaa Precision Engineering IPO List at a 56.15% Premium Despite Missing GMP Expectations?
5. Why Did Manipal Health IPO List at a 10.51% Premium Despite Weak Subscription?
Related IPO Resources
For readers following the IPO market, these contextual resources can help track the broader data:
LEAP India IPO Review — complete IPO financials, valuation, strengths and risks
IPO GMP Today — current and historical GMP tracking
IPO Subscription Status — day-wise and category-wise subscription
IPO Market Analytics — IPO listing and market research
Latest IPOs — upcoming, ongoing and recently listed IPOs
IPO Glossary — explanations of GMP, QIB, NII, RII, Fresh Issue, OFS and other IPO terms
