
Credent Connect N Care Limited made an exceptional debut on the NSE SME platform, listing at ₹359.10 against its ₹189 issue price and delivering a 90.00% listing gain.
The final GMP of ₹92 had indicated a potential listing price of ₹281, or a 48.68% premium. The actual listing was therefore substantially higher than the final grey-market indication.
The IPO also received exceptionally strong demand, closing at 142.38x subscription, with QIBs subscribing 131.39x, NIIs 217.33x and Retail investors 138.86x.
The combination of an unusually strong listing, extraordinary subscription and a large gap between the final GMP indication and actual price discovery makes Credent Connect N Care an interesting IPO listing case.
For a detailed assessment of the company's business, financials, valuation, strengths and risks, read our Credent Connect N Care IPO Review.
Listing Snapshot — Credent Connect N Care
Credent Connect N Care listed at ₹359.10, compared with the ₹189 issue price, delivering a 90% gain.
The final ₹92 GMP implied a price of ₹281 and a 48.68% premium. The actual NSE SME listing was therefore ₹78.10 higher than the price indicated by the final GMP.
Particular | Details |
Issue Price | ₹189 |
NSE SME Listing Price | ₹359.10 |
Listing Gain | 90.00% |
Final GMP | ₹92 |
GMP-Implied Price | ₹281 |
GMP-Implied Premium | 48.68% |
Actual vs GMP-Implied Price | +₹78.10 |
Overall Subscription | 142.38x |
QIB Subscription | 131.39x |
NII Subscription | 217.33x |
Retail Subscription | 138.86x |
Listing Platform | NSE SME |
Massive Subscription and Rising GMP
Investor demand for Credent Connect N Care accelerated sharply during the issue. Subscription rose from 1.99x on Day 1 to 11.23x on Day 2, before reaching 142.38x by the close.
Demand was exceptionally strong across categories, with QIB subscription at 131.39x, NII at 217.33x and Retail at 138.86x, based on the exchange data.
Grey market sentiment also strengthened significantly during the tracking period:
₹0 → ₹10 → ₹35 → ₹46 → ₹50 → ₹72 → ₹52 → ₹75 → ₹65 → ₹55 → ₹45 → ₹63 → ₹70 → ₹76 → ₹78 → ₹85 → ₹92
The GMP movement was volatile rather than linear, with declines from ₹72 to ₹52 and later from ₹75 to ₹45, before recovering to ₹92 ahead of listing.
Both subscription and GMP strengthened substantially as the IPO approached listing.
For current and historical grey-market trends, readers can follow our IPO GMP Today page. Our IPO Subscription Status page tracks day-wise and category-wise subscription.
Rapid Earnings Growth Continued Into FY26
Credent Connect N Care reported a sharp improvement in financial performance in FY26.
Total Income increased from ₹78.23 crore in FY25 to ₹214.43 crore in FY26, while PAT rose from ₹2.25 crore to ₹18.45 crore. EBITDA also increased from ₹4.99 crore to ₹28.46 crore.
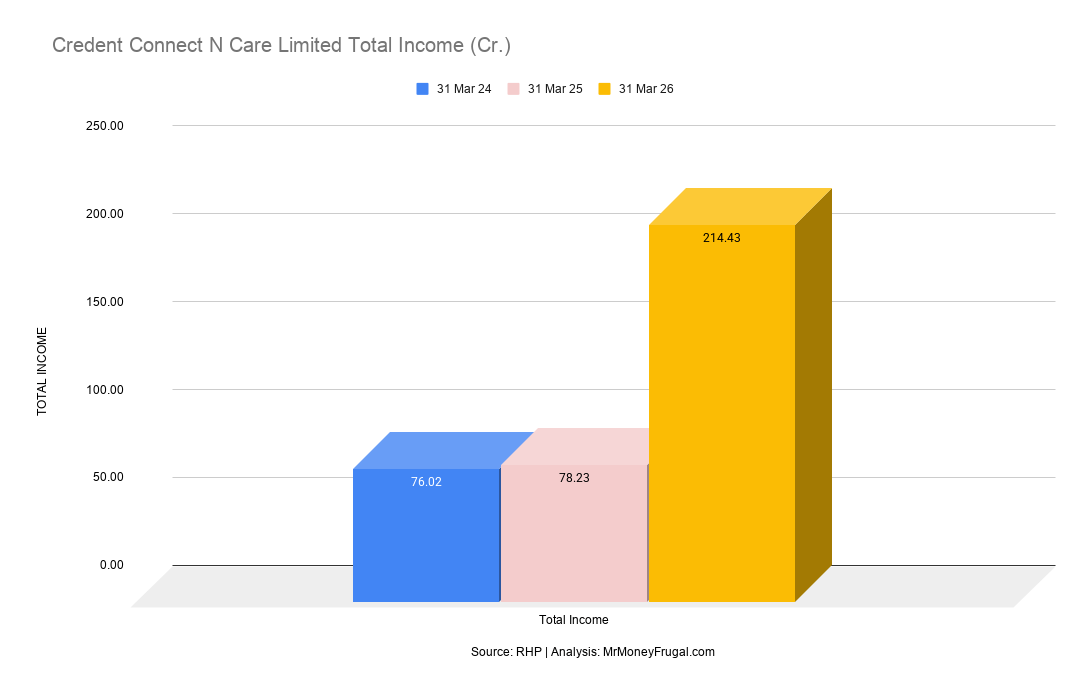
Credent Connect N Care’s total income surged to ₹214.43 Cr in FY26 from ₹78.23 Cr in FY25, marking a 174% YoY increase.
The reported growth rates were substantial: Total Income increased 174%, PAT 720%, and EBITDA 470% in FY26 compared with FY25.
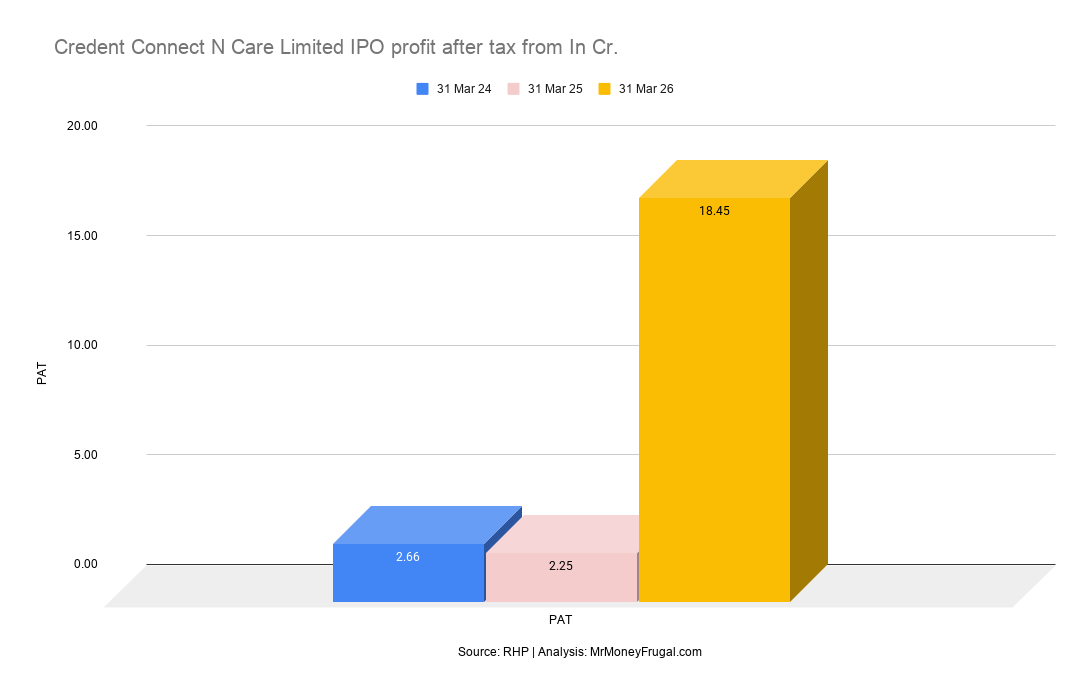
Profit After Tax jumped to ₹18.45 Cr in FY26 from ₹2.25 Cr in FY25, an impressive 720% YoY increase.
The company reported an EBITDA margin of 13.29% and PAT margin of 8.61% in FY26.
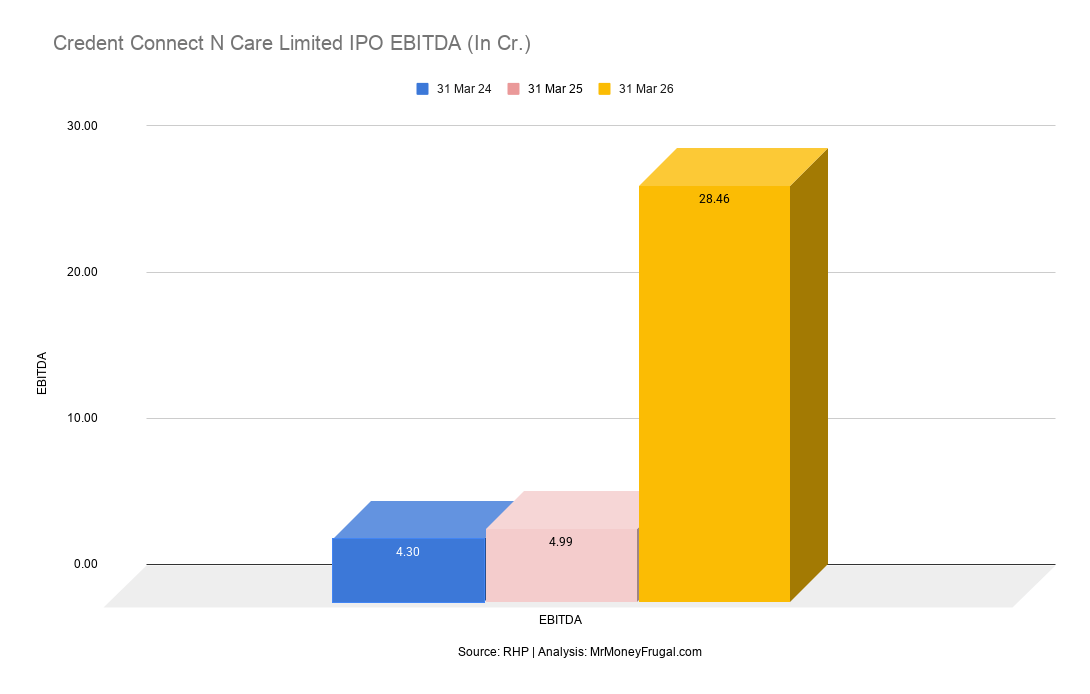
EBITDA rose sharply to ₹28.46 Cr in FY26 from ₹4.99 Cr in FY25, a 470% YoY increase.
However, there is an important qualification when interpreting these growth rates. FY26 financials are reported on a consolidated basis, while FY25 and FY24 are standalone, following the consolidation of three wholly-owned subsidiaries.
Therefore, the very high year-on-year growth should not be interpreted as purely organic growth of the pre-existing standalone business.
The scale-up was also accompanied by a significant increase in the balance sheet. Total assets rose from ₹29.50 crore in FY25 to ₹81.57 crore in FY26, while total borrowings increased from ₹7.42 crore to ₹21.95 crore.
The financial picture was therefore one of very rapid reported growth and sharply higher profitability, alongside a much larger consolidated business and increased borrowing.
This provides the fundamental context for assessing the valuation at which the IPO came to market.
Strong RoNW and Low P/E, but Working-Capital Risks Remained
At the upper price band of ₹189, Credent Connect N Care was valued at a P/E of 13.55x, based on FY26 consolidated EPS of ₹13.95.
The company reported an FY26 Return on Net Worth (RoNW) of 42.13%, indicating strong reported profitability relative to its net worth.
However, the strong reported profitability needs to be viewed alongside the company's working-capital position.
Trade receivables stood at ₹58.83 crore in FY26, while the company reported negative Cash Flow from Operations of ₹6.62 crore despite PAT of ₹18.45 crore.
Customer concentration was another consideration. The company's top 10 customers accounted for 81.76% of FY26 operational revenue, creating significant dependence on a relatively concentrated customer base.
The company also had no directly comparable listed peer, according to the IPO Review's RHP-based analysis. This makes the 13.55x P/E difficult to assess through a conventional peer comparison.
Therefore, while the 13.55x P/E and 42.13% RoNW reflected a strong reported profitability profile, the negative operating cash flow, high receivables and customer concentration were important factors to consider alongside those numbers.
Fresh Issue Focused on Expansion and Debt Reduction
Credent Connect N Care's IPO was entirely a Fresh Issue of 49.68 lakh shares, with no OFS, raising up to ₹94 crore.
Of the proceeds, ₹29.80 crore was earmarked for its subsidiary, ₹37 crore for working capital, ₹6 crore for debt repayment/prepayment and up to ₹10 crore for general corporate purposes.
Unlike an OFS, the entire issue consisted of fresh shares, with the proceeds going to the company rather than existing shareholders.
This makes the issue structure notable: the capital was primarily intended for expansion, working capital and debt reduction.
Why Did Credent Connect N Care List at 90% Despite ₹92 GMP?
The key difference was the scale of actual demand. The IPO closed at 142.38x subscription, with all three investor categories exceeding 100x. This level of demand was substantially stronger than the 48.68% premium indicated by the final GMP.
The GMP did strengthen from ₹0 to ₹92, but it still did not fully reflect the eventual demand-driven price discovery.
At the same time, the IPO came at a 13.55x P/E, while FY26 reported strong profitability with ₹18.45 crore PAT and 42.13% RoNW.
The combination of extraordinary subscription demand, improving GMP and a relatively moderate 13.55x P/E provides the clearest explanation for why the actual listing premium substantially exceeded the final GMP indication.
Related Topics
1. Indo-MIM IPO Listed at 44.33% Premium: Here's Why
2. Why Did Poojaa Precision Engineering IPO List at a 56.15% Premium Despite Missing GMP Expectations?
3. Why Did Manipal Health IPO List at a 10.51% Premium Despite Weak Subscription?
4. Why Did SBI Funds Management IPO List at Just a 6.85% Premium Despite 34.16x Subscription?
5. Why Did Teja Engineering IPO List at a 90% Premium Despite Just 1.06x Subscription?
